Market Update (5/12/2022)

Reverting back to Q&A conversation format for this one… 

Q: Uh oh…  market update time.  I guess that means the stock market is in trouble?

A: I wouldn’t say it’s in trouble because that gives the sense that something bad is about to happen.  We don’t know what’s going to happen in the future.  It sounds like semantics, but it’s an important distinction. What we do know is that stocks have performed terribly to start 2022, especially over the last 6 weeks.  The Russell 2000 (small caps) and the Nasdaq are down ~30% from their highs and the S&P 500 is down 18.5%.  Here’s a quick look at how the major asset classes that we track have performed quarter-to-date and year-to-date (by representative ETF):

High-growth tech has really taken it on the chin with more than 50% of the Nasdaq down more than 50% from its all-time high now.  Stocks in ARK’s Innovation ETF (ARKK), perhaps the “growthiest” of growth stocks, are off even more, with the fund itself down 70%.  Some other high-profile names that were booming a year or two ago make even that look not that bad (Shopify -81%, Zillow -82%, Zoom -85%, Coinbase -85%, Robinhood -88%, Peloton -93%).  The market has woken up and remembered once again that price matters, and you can’t just put all your money in well-known, high-growth names at any price.

Q: That sounds awful. I know that individual stocks carry much bigger risks than the indexes, and that you don’t generally recommend individual stocks, and that PWA clients don’t own any of those names (or ARKK), so I’m not too worried about those. But, how does the decline in the S&P 500 compare to other historical declines?

A: It’s just slightly worse than the average case. Looking at the all the times since WWII that the S&P has dropped by more than 10% from its previous high, on average, it has fallen 14.3% and it has taken 133 days from top to bottom. We’re currently down 18.5% and its been 130 days since the high. So really, this is pretty routine behavior for the S&P.

Another way of looking at this, courtesy of JP Morgan, is shown below:

You can see there are quite a few years where stocks are down significantly at some point during the year, but actually finish the year much better off. In fact, in the 23 years since 1980 that the market has been down more than 10% during the year, it finished up in 14 of them.

Q: You’ve often reminded me that there’s a nearly 100% chance that stocks are going to fall 50% from their highs, in aggregate, during my lifetime.  Is this going to be one of those times?

A: While I’m very certain it’s going to happen eventually, there’s no way to know when it’s going to happen.  That’s why we don’t try to time the market, moving money in an out of stocks pretending we have a crystal ball. Instead, we plan for it in client financial plans and incorporate it as a likely outcome in risk tolerance discussions. That lets us construct portfolios that can achieve client goals regardless of when (not if) the stock market temporarily declines.

Q: From the index returns table, it looks like even bonds are having a tough time. Aren’t they supposed to be the conservative, more stable part of a portfolio?

A: Bond returns can be negative from time to time. But they’re much less negative than their stock counterparts. Additionally, our client portfolios lean toward short-term bonds and incorporate inflation-protected bonds, both of which are down less than long-term or even aggregate bond funds. The long-term US treasury bond fund is down 20% so far this year. Short-term bonds are down 3.5-5.5% and short-term TIPS (treasury inflation protected securities) are actually up 0.3%. When interest rates rise, existing bond prices fall because they’re paying older/lower fixed interest rates, and are less appealing to investors. The shorter the term of the bond (or bonds in a bond fund), the less they’ll fall when interest rates rise because the bonds mature fairly quickly, investors get their principal back, and they can reinvest in new, higher interest rate bonds. With rates as low as they have been, we’ve tilted client portfolios toward short-term bonds, feeling like there’s an asymmetric chance of rising rates over falling rates. Short-term bonds are now paying nearly 3%, vs. the ~1% they were paying a year ago. The good news in rising rates is that while they temporarily depress bond prices, the interest they pay increases (quickly if the bonds are short-term), and eventually you are made whole and then some. Incorporating TIPS into portfolios also helps in times like these because TIPS pay a fixed interest rate + an inflation adjustment. When rates rise due to higher inflation, the higher inflation adjustment increases the interest payment and helps to offset the impact of the higher rate on fixed interest bonds prices. So, while this has been an ugly period for bonds, it’s within the bounds of what we expect for this type of environment and is going to lead to higher interest payments over the next couple of years a result.

Q: Understood. So what’s causing all this financial market stress?

A: It’s hard to know with certainty, but I’d say a combination of fear of rising inflation and fear of slowing economic growth around the world. Inflation had been running stubbornly below the Fed’s 2% target for quite some time and has recently accelerated substantially (see table below). As world demand for goods and services came back online after covid, supply was unable to keep up. Supply chain issues led to goods shortages and rapid growth in open job positions led to employee shortages. This combined with seemingly endless money printing to support the post-financial crisis / post-covid economy and large fiscal stimulus resulted in too much money in the system chasing shortages of goods and services. People had savings and didn’t want to go back to work in a restaurant. Everyone wanted to travel at the same time. There was suddenly worldwide demand for energy at a pace that made negative oil prices of two years ago seem like a lifetime ago. It started with energy, then travel / tourism, then hospitality / dining, and now is impacting just about everything. The war in Ukraine caused another jump in energy and food prices and put more pressure on inflation. China’s latest bout with covid has also further increased supply shortages on various goods imported around the world.

As a result, the Federal Reserve and other central banks are pulling back on the liquidity they’re providing via Quantitative Easing (money printing to buy government debt and finance spending more than we’re collecting in tax revenue) and starting to raise interest rates. This month, the Fed raised interest rates by 50 basis points, taking overnight rates up to 0.75-1.00%, following a 25 basis point hike in March. They’ve signaled much more on the way.  

Q: How much more?

A: Fed Funds Futures markets tell us (see derived probabilities below) that the market is currently forecasting nearly 3% rates by the of 2022 with potential of higher than that into 2023.

Q: Wow. That’s a pretty big change from what the economy is used to right?

A: Exactly. And it’s happening very fast. In anticipation of the higher overnight rates, longer-term rates have been climbing. Mortgage rates which were in the mid-3% range last year are suddenly over 5.5%. This puts pressure on housing and other activities that depend on financing. Q1 GDP came in negative (i.e. the US economy shrank in the first three months of 2022) and so the Fed is planning on substantial more tightening into a rapidly slowing economy.

Q: This is starting to sound really bad. Where’s the good news? There’s always good news isn’t there?

A: There is good news. Rising rates and a slowing economy should bring inflation back down. Eventually, higher prices tend to also bring more supply online (more people come into the workforce if they’ll get paid more, more oil drilling projects if the price of oil is ~$100/barrel, more crops planted if wheat/corn/etc. prices are high). The faster supply increases and demand decreases, the more dovish the Fed can be. While prices will likely remain high, it’s their year-over-year change that matters to the Fed. They don’t want a wage-price spiral to begin and take prices endlessly higher in a self-reinforcing cycle. Now, the market has already priced in massive interest rate increases. Either the economy withstands those increases and continues chugging along (means better than expected growth), or the economy puts on the brakes (means no need to take rates much higher than that, if at all). Either scenario would help stocks find a bottom and start to recover. The real danger is that the Fed raises rates too quickly in its attempt to break inflation and really hurts the economy or they don’t raise rates quickly enough and inflation accelerates from here, causing rates to ultimately have to go even higher in the future. The higher that terminal rate, where the Fed stops hiking, looks to be, the harder it temporarily is on stock and bond values. There are some signs that inflation may start to slow soon though. Using TIPS vs. non-inflation protected treasuries, we can look at what the market is pricing for future inflation. Below is a chart of the 5-year breakeven between the two, a measure of future inflation expectations. The red box shows that inflation expectations have started to decline in recent days.

Q: Ok, here’s the million dollar question…  when is this all going to get better.

A: Timing is impossible and no one has a functioning crystal ball (though many in the financial industry will try to sell you one!).  I wouldn’t expect an immediately turnaround. But, every time stocks have fallen in the past has turned out to be a buying opportunity in hindsight.  Coincidentally, every time stocks have fallen in the past has looked like impending doom.  If you’re a net saver, then the lower stocks go, the better for you as your purchases are being done cheaper than if the market never dropped.  If you’re a retiree, and a net spender, then much of your portfolio isn’t in stocks and your portfolio has been stress tested to endure well beyond the current drop (if you’re a PWA client that is). I can’t reassure you as to when it will get better. I can reassure you that the timing doesn’t really matter. It will get better eventually and we’ll be in an even better place financially when it does.

Q1 2020 Returns By Asset Class

For the last several quarters, I’ve posted returns by asset class (by representative ETF), as well as last twelve months, last five years, and since the financial crisis lows of 3/9/2009. While there is still no predictive power in this data, I updated those charts as of the end of Q1 2020 for those of you that are interested.  Charts shown in the link below, with each on a separate page, legend at the bottom, zoom to your liking):

2020Q1 Asset Class Performance

Given all the recent blog posts explaining what’s going on, I’ll provide limited commentary on this.  What started as a fairly positive quarter turned ugly at the end of February and downright brutal across risky asset classes in March.  A few notes:

  • Bonds (many of which are now backed by the Federal Reserve’s purchasing power) acted as dampeners of the poor returns, as expected.  The more aggressive your portfolio, the more stocks and less bonds you have, the more magnified negative returns are for Q1.  The aggregate bond index was up 2% for the quarter while short-term corporate bonds were down about 2% due to the slightly worse, but still investment grade, credit quality of corporate bonds vs. treasuries.
  • Junk bonds and emerging market bonds outperformed equities, but still took a beating in Q1 (-12% and -16% respectively).
  • US Large Cap stocks continued to outperform small caps and foreign stocks.  But while the relative performance was better, the overall returns were still -20%.
  • US Small Cap stocks were the worst performers (-30%) and that was after a spectacular final week of the quarter.  Some portions of the Small Cap world (not shown) were even worse.  Micro Cap stocks (-35%+), US Small Cap Value (-40%+) (not shown).
  • Foreign Developed and Emerging Markets took it on the chin as well, down ~24% each.
  • Commodities in aggregate were down ~30%, but energy had it’s worst quarter of all time after Saudi Arabia & Russia decided to start a price war, pumping extra supply into the middle of the covid-19 global economic shutdown.  Energy as a whole (via Vanguard’s Energy ETF) was down 53% while Oil & Gas Equipment & Services were down a whopping 72% in Q1 alone.


Another Rough Week

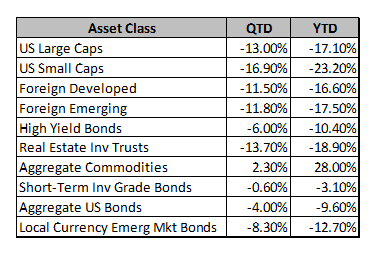
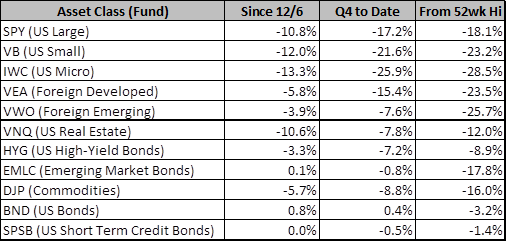
This was a rough week for the stock market, coming after an already ugly start to the quarter. Since my last update on 12/6, global stock markets have continued to decline, with the US finally starting to catch down to the malaise that the rest of the world has been experiencing for most of 2018. Surveying the damage, here are the % changes since 12/6, since start of Q4, and since the 52-week high for various ETFs (ignoring dividends):

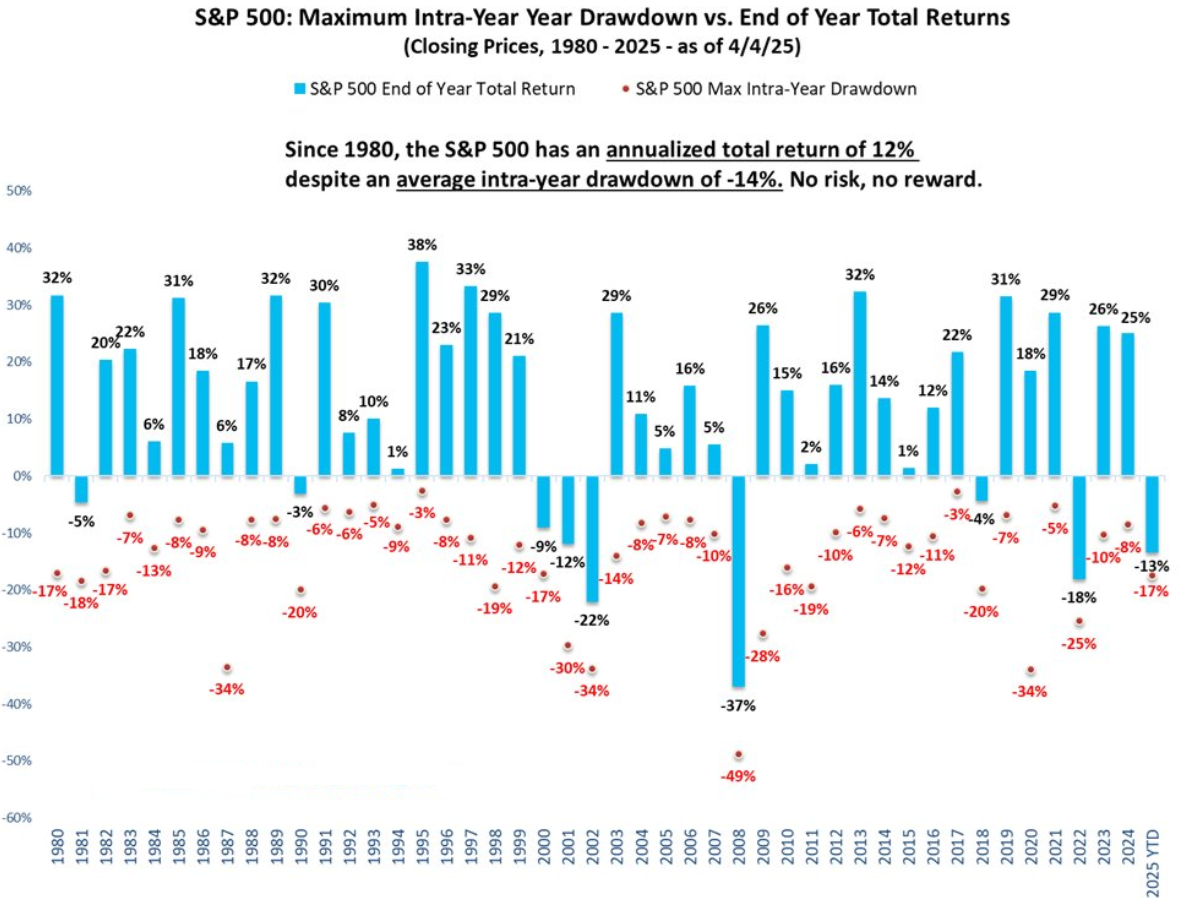
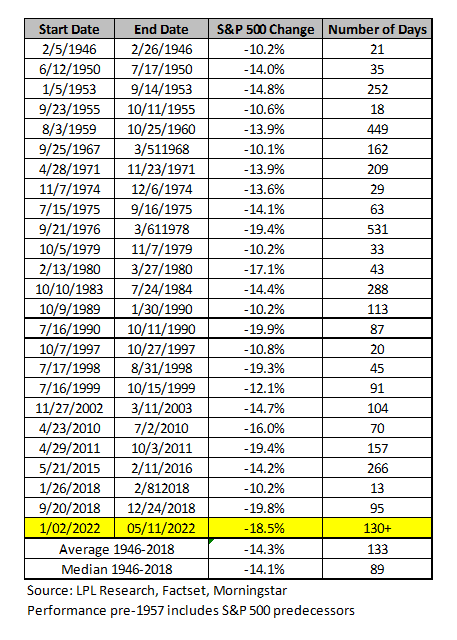
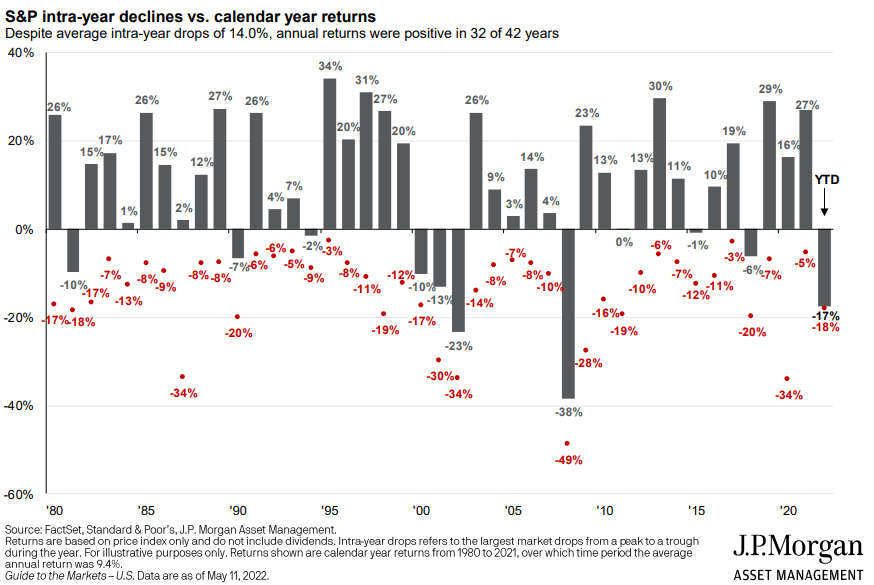
The most aggressive portfolios are down 15-20% for the quarter. The most conservative are approximately flat. Most of your portfolios lie in between with retirement portfolios for those of you with a long way till retirement being quite aggressive, but likely still down 10-18%, balanced portfolios down 7-14%, and more conservative portfolios down a few percentage points. Almost all portfolios are now down from where they were a year ago. As I said in the 12/6 update, this may seem like an extreme drawdown after years of low volatility, but from a historical context it’s not. It has happened faster than most declines in the recent past, but that could very well be a good thing if it means a shorter interval of declines. I don’t really worry about the short-term movements of stocks, but I do worry about the damage to consumer and business confidence that deep, drawn out declines can cause. Losses never feel good, but as long as we can stand the loss without needing to liquidate or liquidating in panic, they actually are good in two ways. They reset stocks and asset classes to lower valuations while shaking out the weak-handed or leveraged market participants, providing a future opportunity to grow. They also provide an opportunity to invest more money at lower prices. If you invest $1,000 per month for 20 years in a market that gains 8% per year every year vs. a market that ends in the same place but experiences 20% losses every 5 years along the way, you wind up with almost $45,000 more in the latter case. This is what we experienced from the 2007 top to the recent 2018 top. Without the financial crisis and its opportunity to invest at MUCH lower prices, portfolios wouldn’t be nearly as big as they are today. Try to keep this in mind when dealing with the pain of quarters like this one.

As far as why this is happening, I outlined the major market concerns in Part 2 of my last post. I won’t rehash those. But in the last couple of weeks, the following distinct events occurred that added to market uneasiness around those points:

· Trade talks resumed with China, but the administration said (after many mixed messages) there is no flexibility on the 3/1/19 deadline for a deal. They also are on record saying a deal would be difficult in such a short period, and the president is on record saying that if it doesn’t happen, he’s ok proceeding with increased tariffs, “I’m a tariff man”. Without getting political, this does not inspire confidence in a resolution to the trade war. In fact, it tells international markets to prepare for intensification.

· Oil continued to plunge, down 12% from 12/6 and a whopping 38% just in Q4 2018. While this is good for the average consumer (gas prices, heating oil, airline tickets, shipping costs), it is not good for that portion of the US economy, which has had massive growth and has taken on a lot of debt over the past 10 years. High debt and low oil prices will pressure the balance sheets of oil companies and ultimately lead to defaults, bankruptcies, and business closings. None of those are good for markets and the weakness in the energy sector is causing tightening in credit markets with potential for spillover outside of energy.

· Federal Express released earnings that were mostly in-line with estimates, but substantially decreased guidance for the remainder of their fiscal year (two more quarters) on a slowdown in global shipments. One might think this is the classic attempt at UPOD (under promise over deliver) and that FedEx was using recent market weakness as an opportunity to set expectations low for the next few quarters. However, they’re actually acting on their reduced forecasts by reducing their global shipment processing capacity. You don’t do that unless you know the economy is slowing, at least internationally. They’re just one company, but as a global shipping juggernaut, their actions are concerning.

· The Federal Reserve held its last meeting of 2018 and raised interest rates by another 25 basis points. The move was widely expected, though there was hope that they would instead pause given recent market performance. They did not pause and while they walked back their estimates for the neutral interest rate as well as expectations of 2019 hikes (from 3 to 2), that was not enough for markets. Fed Chairman Jay Powell tried to ease markets during his press conference by repeatedly stating that there was no pre-determined course for interest rates and that the Fed would adjust their policy and their forecasts as economic data came in. Then he made a huge (in my opinion) communication error by stating that the Fed would not alter their plan to reduce their balance sheet (reverse the Quantitative Easing purchases of treasuries using printed money), commonly known as Quantitative Tightening. While I’m sure he meant that it wouldn’t be altered except in extreme conditions, he said flat out, that it wouldn’t be altered. Stocks tanked as a result. There have since been attempts to walk those comments back by the other Fed governors, but the damage to confidence has already been done. This is not as bad as an actual Fed policy mistake, but a communication mistake that causes volatility and a loss of confidence in the Fed as a backstop when the proverbial “stuff” hits the fan, really shakes the markets.

· From a technical standpoint, for the traders, computer algorithms, and funds that follow chart trends and more numerical data points on the market, the damage done by the above created multiple “sell” signals. I won’t get into “Dow Theory”, broken trend lines, violated moving averages, “death crosses”, and broken long-term support. Suffice it to say that a segment of the market has decided it’s safer to sell than to buy or hold at this point and they are doing so quickly and at any price. This cycle of losses triggering more selling probably triggers margin calls, hedge fund liquidations, and more forced selling which takes a while to clear through the market. It often takes prices well below fair value for sidelined buyers to step in, break the cycle, reverse the trend, and flip all those technical indicators back to “buy” signals.

The potential good news is that we’ve hit some extremes on sentiment that can be viewed as exhaustion points for selling. This is based on the idea that when everyone in the world has become bearish and has sold, there is no one left to sell and markets bottom. Think March, 2009. Over the last few days we experienced the following:

· The CBOE put/call ratio hit an all-time high. That means that substantially more bearish bets were being made through the options market than bullish ones. So much so that the level of downside bets to upside bets exceeds recorded history.

· The CNN Fear & Greed Index hit 3 (on a 0-100 scale with 0 being the most fear and 100 being the most greed). The index hasn’t been around for that long, but I don’t remember ever seeing it that low.

· The AAII Investor Sentiment Survey results show that only 25% of people are bullish with over 47% bearing (almost the exact opposite of the start of Q4). They note that “Optimism and pessimism remain outside their typical ranges: bullish sentiment is unusually low and bearish is unusually high. Historically, both have been followed by higher-than-median six- and 12-month returns for the S&P 500 index, particularly unusually low optimism.“

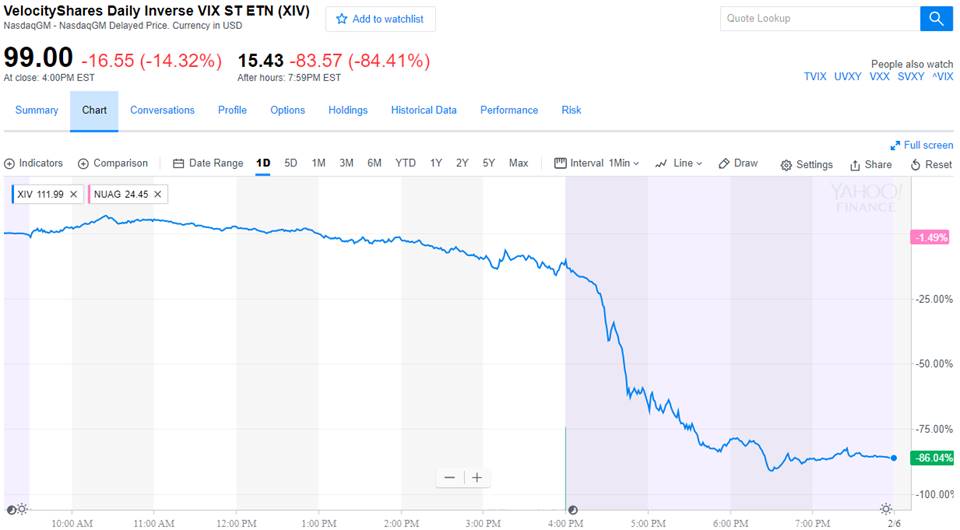
· The VIX, Wall Street’s fear gauge that is based on the annualized expected change in the S&P 500 based on short-term options pricing hit 30. That implies an annualized 30% move, up or down, in the S&P 500. While it can certainly go higher, market average is in the 15-20 range and last year at this time it was below 10. It tends to spike when fear is high and short-term traders are buying options and willing to pay a hefty price to hedge their portfolio positions.

· The SKEW index, which shows the relative price of out-of-the-money puts (bets that the market will drop big) to out-of-the-money calls (bets the market will rise big) has finally started to move up from a multi-year low. The complacency that had crept into the market, even through the October declines, is finally waning.

I’m not saying the drop is over and prices will snap back. It remains to be seen what the economy actually does in 2019 and how monetary policy and fiscal policy evolve as a result. We’re nowhere near what happened in 2002-2003 or 2008-2009 and I’ve told all of you many times to prepare to lose 50% of the money that you have in stocks at some point during your lifetime. This could be it. Or it could not be. The market is always correct and I think it has correctly priced in the known risks and more importantly, the risk of the unknown heading into the next couple of years. Selling has been extreme, but that doesn’t mean it has been “overdone” simply because of extreme indicators, nor does it mean that this is just the beginning of the decline, simply because uptrends have been broken and Dow Theory says it is. We have continued to harvest losses for tax purposes where appropriate and to rebalance portfolios back to their target stock/bond weightings. If stocks continue to fall, there will be more of this. If they don’t, then our rebalancing actions of selling bonds and buying stocks (the reverse of what we’ve been doing during the bull market) create the perfect buy low / sell high rhythm, while keeping portfolio risk levels and return targets in sync with client goals.

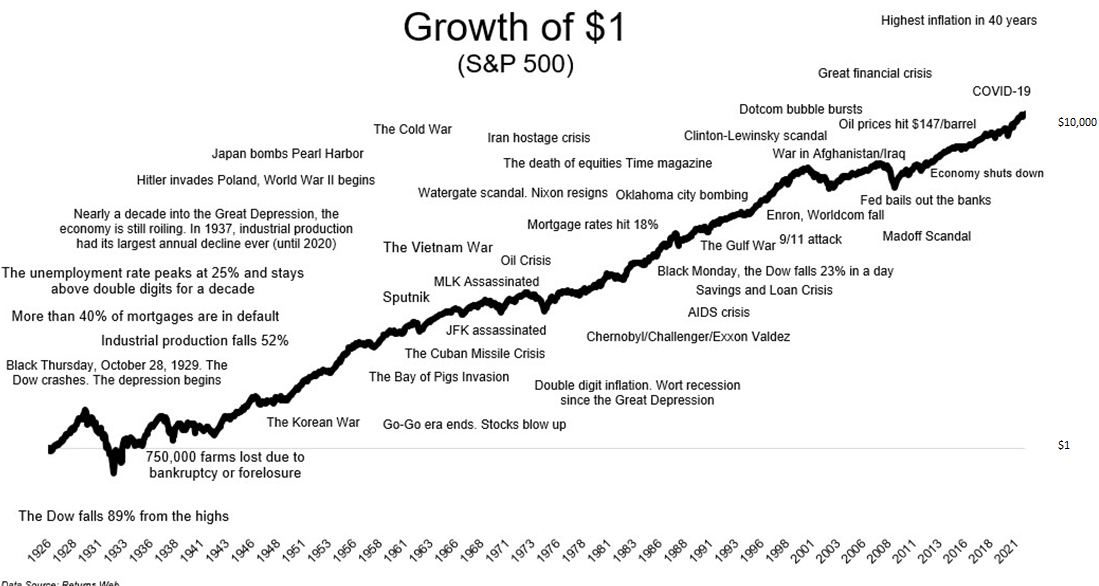
There is no doubt that losses cause pain. We all work hard for our money and hate to see it evaporate in a market decline. There is no way to earn equity returns over the long term though without being willing to live through the declines. If there were no risks in stocks, they would pay 2% as FDIC-insured bank accounts do. We investors signed up for this risk and if nothing else, we should take solace in the fact that lower prices are a good thing when you’re a buyer. We should also remember that there have been thousands of crises, recessions, political upheavals, natural disasters, wars, and plagues. It’s not a coincidence that even after all of that, we were recently at all-time highs with all-time high global population and all-time high measures of productivity. Humans will continue to worry and humans will continue to create better lives for themselves and their children. This (the current downturn) too shall pass.

If you’re reading this as a PWA client and have questions or want to discuss your individual portfolio, goals, etc., as always, please don’t hesitate to contact me. I hope you all have a wonderful holiday season filled with friends, family, and fun.

Q1 2018 Returns By Asset Class

For the last few quarters, I’ve posted returns by asset class (by representative ETF), as well as year-to-date, last twelve months, and last five years. While there is still no predictive power in this data, I updated those charts as of the end of Q1 2018 for those of you that are interested (see below).  Note that there is no year-to-date chart in this quarter since year-to-date and last quarter are the same.

2018Q1 Asset Class Performance

A few callouts from the data:

  • Most asset classes finished Q1 down between 0.5% and 1.5%.  This is a far cry from “Markets In Turmoil”, as CNBC likes to call it whenever stocks move down for a few days in a row, but it is still the first down quarter in a long time.  The standouts on both sides of the flat line were Emerging Market Bonds (+~4%), Emerging Market Stocks (+~2.5%) and US Real Estate Investment Trusts (REITS) (-~8%).
  • All asset classes other than REITs remain positive over the last 12 months, led by Emerging Markets and Foreign Developed Markets.  As I’ve pointed out quite a few times in the last few years (and as can be seen on the 5-year chart), foreign stocks a have a lot of catching up to do vs. US stocks from a performance perspective.  Of course there’s no way to know whether they will catch up with the US or if there’s good reason for their underperformance.  At least over the last year, a bit of catch-up has occurred.
  • After smooth sailing in 2017, volatility returned for Q1 2018.  You’ll notice a lot more ups and downs on the 12-month chart over the last 3 months.  What feels like a bit of a roller coaster over the last few months is actually much more normal from a historical perspective than 2017 was.
  • Bonds (short and medium term) are still up slightly over the last 12 months despite another interest rate hike by the Fed.  The Fed Funds rate target is now 1.50-1.75%.  Futures markets are pricing in another two Fed rate hikes in 2018, with about a 30% chance of three more hikes.

Market Update (2/5/2018)

I had hesitated to send one of these out after the two-day pullback in the market because while it looks bad on a point basis (Dow, S&P, etc.), it’s far from exceptional on a % basis, which is what counts. After today’s fall, the S&P is down a little over 1% for the year. Some other assets classes are down a bit more, others are still up on the year. This is far from “Markets in Turmoil”, but that business news headline attracts attention, raises fears, and up go ratings. Because of that, I thought a quick note was warranted to both show there is not turmoil at this point and to give you my perspective on what’s going on. Here’s a quick look at year-to-date performance (including any dividends paid) by asset class (representative ETF) AFTER today’s “plunge”:

US Large Cap (SPY): -1.1%

US Small Cap (VB): -2.7%

Foreign Developed (VEA): -1.5%

Foreign Emerging (VWO): +1.7%

Real Estate Investment Trusts (VNQ): -9.9%

High-Yield Bonds (HYG): -1.3%

Aggregate Bonds (BND): -1.4%

Short-Term Investment Grade Credit Bonds: CSJ: -0.1%

Local Currency Emerging Market Bonds: +2.5%

Aggregate Commodities: +0.5%.

As you can see, with the exception of REITs, which are getting beaten up as interest rates rise, this is far from turmoil.

What happened today is concerning though. Stock markets behaved erratically. Futures liquidity dried up as this started to happen and liquidity in the S&P 500 futures contracts after-hours tonight are as low as they have been in a long time. That means it’s fairly easy to push the market around with relatively small orders, causing big moves in either direction. As a result, S&P futures have been moving 10+ points repeatedly over only a few minutes throughout the evening (this is the equivalent of the Dow moving in about 100 points per few minutes). The markets are down sharply overnight, with recent lows having Dow futures down another 1100 points from today’s close and S&P futures down a little over 100 points. This isn’t being caused by economic issues, bank liquidity issues, terrorism, recession, or anything that caused the last two major (-50%+) market falls. In my opinion, it’s being caused by large, leveraged bets on continuing low volatility which are unraveling in what should have been some mild profit-taking and re-pricing as interest rates moved a bit higher in January. Volatility has been running well below normal as I’ve pointed out in recent quarterly updates. Futures markets generally price in a return to normal volatility over time. Therefore, if one shorts future volatility in futures markets (or via multiple exotic ETFs and other financial products) and volatility remains low, money can be made over and over again very quickly. Hedge funds have been started that engage in this tactic and it has paid off massively over the past year as there has been virtually no volatility in the stock market. The longer the strategy pays off, the more money moves into it, chasing its success. People / funds begin to borrow money to invest in the strategy (leverage) because they can pay a few % of interest per year for their borrowing costs and make 10%+ per month if the strategy continues to do well. For all of history this has been a recipe for disaster and sure enough, it is beginning to unravel. An otherwise ordinary increase in volatility surrounding a few days of rising interest rates / declining stocks causes these bets on low future volatility to lose massive amounts of money very quickly. Fear that they won’t be able to pay back their loans causes margin calls which forces more selling of this strategy. Selling of short volatility funds is essentially buying volatility into a spike in volatility, which causes (of course) more volatility. Other hedge funds know this is happening and try to take advantage of the forced volatility buying (stock selling) causing even more. From there, it’s the same old vicious cycle that has fueled market drops like this in the past. Want proof that this is what’s going on? Today was the single biggest % increase in the VIX (the volatility index) in the history of the market on what wasn’t even in the top 100 down days on a % basis in the history of stocks. Want more proof? Here’s the after-hours chart of an exchanged traded note that tracks the inverse of the volatility index (I know that’s a mouth-full… it’s basically one of these short-future-volatility funds that is blowing up):

You’re reading that right… -86.04%, just since 4pm today! This is going to cause some hedge fund meltdowns. It’s going to cause some margin calls. It’s going to strain markets for a while. But I find it hard to believe an obscure greed-based strategy is going to bring down earnings growth, which is really starting to pick up around the world. That’s not to say there aren’t other factors playing a role here, but I think this short-volatility blow up is a big part of it. Another cue that this is probably a shorter-term event is that it’s not flowing through to currency markets at all (at least not yet). Despite futures being down 4% overnight, the dollar index, a normal flight to quality when there is a lot of fear in the market, is up only 0.1%.

Anything is possible, and as I’ve said many times, I’m certain that the stock market will eventually fall more than 50% again. We probably won’t see it coming in advance of that happening. But, if someone forced me to place a bet, I would bet that this will be a fairly short-term event that will allow the market to build again from whatever bottom that forms. To be clear, I’m not advising anyone to invest money they wouldn’t otherwise invest as a result of this. I’m not advising anyone to be more aggressive or conservative in their portfolio or to reposition assets in any way (other than usual rebalancing) as a result of this. Financial plans are designed to weather market moves, not predict them, and not time them. I know seeing your portfolio value fall hurts. For some of you, it makes you want to sell stocks. For others, it makes you want to aggressively buy stocks. But it is going to happen over and over again and is the price you pay for the kind of growth you’ve experienced over the past several years. Markets can’t only go up, despite what they’ve done in the past year. We’ll be rebalancing client portfolios on the way down (sell bonds, buy stocks), just as we rebalanced in the other direction (sell stocks, buy bonds) on the way up. And, it never hurts to have your planned contributions and 401k deposits go in at a lower level than they otherwise would have.

In short, expect that wild swings in either direction are possible over the next several days. I hope that with the explanation above, you’ll find what happens more interesting than traumatic. As always, if you’re reading this as a PWA client, feel free to contact me with any questions.

Q4 2017 Returns By Asset Class

For the last few quarters, I’ve posted returns by asset class (by representative ETF), as well as year-to-date, last twelve months, and last five years. While there is still no predictive power in this data, I updated those charts as of the end of Q4 2017 for those of you that are interested (see below).  Note that there is no year-to-date chart in this quarter since year-to-date and last twelve months are the same.  Instead, I just included one Full-Year 2017 chart.

2017Q4 Asset Class Performance

A few callouts from the data:

  • All asset classes displayed finished positive for 2017.  International markets led the way with emerging markets up 33% and developed foreign markets up 28%.  About 10% of this gain, is due strictly to currency fluctuations as the US Dollar finally took a breather vs. most foreign currencies in 2017.  That makes foreign holdings worth more in US dollars and juices returns a bit, offsetting some of the dollar gains / foreign losses in recent years.  Local currency emerging market bonds were up 15% for the year, due in part to the same currency impact.  As can be seen on the 5-year chart, foreign markets have a lot more catching up to do vs. the US, though there’s no way to know when that’s going to happen, or if the gap gets wider before it eventually starts to narrow.
  • US stocks continued their solid run with large caps up ~22% and small caps up ~17% on the year.  While those numbers aren’t extraordinary from a historical perspective, the lack of volatility was.  For the first time in the history of the S&P 500, all twelve months of the year had positive returns.  Don’t expect that to happen again, but if you think 20%+ returns usually means no chance of good returns the following year, you’d be mistaken.  The S&P 500 was up 20%+ 18 times since 1950 and in 16 of those times, the following year was higher (per LPL Research).
  • Bonds (short and medium term) had another positive year despite three more interest rate hikes by the Fed.  The Fed Funds rate target is now 1.25-1.50%.
  • Commodities (energy, metals, agricultural products) finished the year positive and are up substantially from their bottom in early 2016.  However, the oil crash really took its toll and as such, aggregate commodity funds are still down ~40% over the last 5 years.

Market Update – End of Q2 2014

There’s an old saying on Wall Street that markets tend to climb a wall of worry. That couldn’t be more true over the last few years. Whether it’s our own political and fiscal dysfunction, high unemployment, geopolitical tensions in the middle east, a debt crisis in Europe, slowing growth in emerging markets like China, the old “too much too fast” theory on stock market gains, the Federal Reserve and other central banks printing money, the potential end of that money printing, etc., there has been no shortage of reasons to worry the next correction cometh soon. Yet the stock market, as it usually does, makes a fool of those who try to predict it’s short-term behavior, and continues to climb that wall of worry. There is also no shortage of stock market prognosticators. Despite natural instincts to attempt to join them, I avoid it wherever possible and help clients design a plan that will be successful regardless of what the stock market does over the short-term. We don’t have to predict the short-term movements of the stock market in order to invest money toward particular financial goals. We simply have to keep money that’s necessary for short-term goals, predominantly out of the stock market!

As strongly as I feel that trying to predict market movements is a fools game, I do think it’s possible and necessary to present a rational explanation for what the stock market has done in the recent past. This is to help clients past the natural fears that prevent them from sticking to their plan at times like 2009 (and for some, even now because of a feeling that the market is “too high”). It’s also to help clients past the natural greed that can develop when you see cash earning nothing for years while the stock market gains 200%. I believe that those gains came as part of a recovery cycle from very depressed levels, spurred on by the actions of the Federal Reserve and other central banks around the world. Those actions (low short-term interest rates, quantitative easing or “QE”, and forward guidance in the form of promised low rates for an extended amount of time) allowed the recovery cycle to take place in an environment that could otherwise have taken decades. I think of the recovery in four phases of realization that impart increasing and self-reinforcing confidence in the economy and financial markets. I describe them in more detail below, but for those without the time/desire to read that detail, they run from 1) “the world is not ending”, 2) “we’re growing again, but only because of the Fed”, 3) “interest rates are absurdly low and won’t stay that way for long” to 4) “we’re growing and interest rates are staying low even as the Fed pulls back”. With each realization, the stock market has made a move higher. The phases, in more detail:

· Pre-Recovery: Markets plunging, unemployment soaring, Lehman default, credit markets seizing up… I described the aggregate psychology of the markets during this period as beginning to price in the potential for the end of the financial world.

· Recovery Phase 1: Fed starts ZIRP (zero interest rate policy) and QE (quantitative easing). Unemployment peaks. Stock market bottoms. On 3/24/09, I wrote about QE as a “game changer”, just after that bottom. I’d describe the psychology of this period as pricing out the potential for the end of the financial world. The stock market in March of 2009 had essentially fallen 60% from peak in October 2007. Earnings estimates for S&P 500 companies for the next 12 months had fallen from over $100 per share at peak to ~$60 per share. At the same time, fear in the markets led to PE contraction and the S&P 500 PE fell to just over 10 (for more on PE and market valuation, please see this recent blog post). I remember discussing this with a colleague and stating that “applying a trough multiple to trough earnings is a trough in intelligence.” When earnings fall and have a massive path of recovery in sight (growth back to peak earnings over the next several years), PEs should expand to reflect that, not contract. This is exactly what happened. Over just a few months, PEs expanded back to their market average around 15-16 as the S&P 500 gained 50% from bottom with little change in future earnings estimates.

· Recovery Phase 2: Over the next few years, the Fed continues QE and adds its guidance that rates will stay low for an extended period. The economy begins to grow again, slowly. Job creation picks up to slightly above the level of population growth. Unemployment slowly begins to fall. The stock market continues to climb, but now due to increases in earnings due to a growing economy. At the same time, the unsatisfyingly slow growth weighs on confidence and though earnings are expanding, PEs begin to fall again on concerns for future growth.

· Recovery Phase 3: The Fed launches its new open-ended QE program, called “QE Infinity” by some (see Monetary Bazooka Fired). The Fed promises to keep rates low even longer (first through 2015, then till unemployment falls to a threshold, then beyond that). Interest rates plunge to historical lows as a result of QE and the Fed’s promise. The economy still grows slowly, job creation is still slow, and unemployment continues to fall slowly. Confidence seems a bit higher in the economy and in the Fed’s ability to create a no-lose situation. PEs expand again along with growing earnings and the stock market makes another strong move higher. This time though, I think the reason for the PE expansion is the promise of lower long-term rates for a very long time. We see dividend-paying stocks like utilities and REITs due extremely well in this environment because low interest rates makes their high dividends seem even more valuable. The economic recovery still doesn’t seem to have reached self-sufficiency though with the Fed still pushing it. What happens when the training wheels come off the bike and it has to pedal on its own? In phase 3, that was the market’s biggest worry.

· Recovery Phase 4: The Fed announces the tapering of its QE program, slowing bond purchases with hope of ending the program by late 2014. Markets hiccup on fear that this marks the beginning of the end for low rates. Rates begin to increase, PEs contract, and the stock market dips into the summer of 2013. The Fed reacts by strengthening its resolve to keep rates low well beyond the end of QE. Into early 2014 as the Fed continues to cut back on QE, Europe and Japan embark on monetary easing programs (Japan is in a massive QE program already and Europe begins to hint at one to come). European interest rates, even those for fiscally troubled countries like Italy and Spain plunge to levels that approach US interest rates because of growing confidence that the European Central Bank (ECB) will do anything and everything to make sure those countries don’t default. If Italy’s 10-year treasury yields 3% and the US 10-year treasury (thought to be much much safer than Italy’s bonds) yields 3%, that puts a cap on how much US interest rates can rise. Now, in mid-2014, even though the Fed is almost done with QE, the fear of rapidly rising rates remains in check due to central bank actions overseas. If rates are going to continue to remain low long-term because of those actions, then PEs should expand again to reflect that. Additionally, confidence that the economy won’t falter as rates rise takes hold. Housing can continue to recover. Employers can hire and plan for growth. Consumers can spend without worry of erosion in the jobs market. This is precisely what has happened over the past few months as unemployment has taken another dip down and job creation has picked up sharply. PEs have expanded back out to 15-16 on the S&P 500 (based on next 12 month’s earnings), right at their historical average. The recovery now appears closer to being self-sustaining, or at least is no longer dependent on the Fed’s QE (might still be dependent on Europe and Japan though).

That brings us to present day. Can self-sustaining (or ECB induced) economic growth increase earnings enough to push the stock market higher? Can the expectation of low interest rates for the foreseeable future push PEs above historic averages thereby pushing the stock market higher? Could both happen and really put upward pressure on the market without a spike in inflation? I believe this latest run up in stocks has come from more and more belief that the answer to all of those questions can be “yes”. This, in my opinion, is where the danger lies. If the market starts to price in “yes” answers, but the economy falters and earnings estimates turn out to be too high, or the ECB doesn’t go as far as everyone is expecting, or inflation starts to rear its ugly head and interest rates start to rise, putting pressure on PEs, we could be in for that correction everyone has been expecting for the last 5 years and 200% of gains. Remember, when the wall of worry disappears, stocks may no longer have anything to climb. So, there are lots of reasons to be positive and lots of reasons to worry about being positive. Again, I can’t predict the future, but I do hope my interpretation of why stocks have climbed 200% in 5 years helps you see that we’re not living in a world of irrational exuberance. I also hope my warnings of what could go wrong in the future can keep the greed-monster in check. Stocks are not massively over-valued, nor are they under-valued (S&P 500 PE is 15.55 at the time of this writing, which right about the historical average). There are pockets of stocks that seem very expensive (small cap growth companies, especially in the social media and cloud space), but not the market overall. Stocks have merely recovered from insanely low valuations, have reflected the growth in earnings in recent years, and have adjusted to a new level of long-term interest rates. While corporate margins are at the typical cycle highs, there is still room for revenue expansion if the economy as a whole picks up. We just need to be careful not to count on sharply rising earnings before they occur and not to price in very low long-term rates forever (forever is a very long-time).

This brings me to a related and important point. A few of you have asked in recent months for my stance on what I would do in an insanely and clearly overvalued stock market situation. If such a situation was to present itself (and seeing it might be like trying to drive around a corner while looking in the rear view mirror), I’m prepared to move models to a more conservative allocation and wait for the economy to catch up to the stock market. I’m not saying that evidence will always present itself before the market falls (it would be atypical if it did). I’m not saying we’ll ever move to “all cash” or “all in” at any point regardless of the evidence. I am saying that in an extremely overvalued situation, expectations of future returns will be lower, but risk will be higher. If that’s overwhelmingly clear, it would make sense to reduce risk temporarily, as a matter of prudence, not as a prediction of an impending market disaster. I have been close to doing this a few times in the past, but have a high tolerance when it comes to “overwhelmingly clear”, and so I didn’t act. Doing so would have missed at least a period of one of the biggest bull markets in history. Making such a move, even a small one, is not something I’d take lightly (especially with tax complications in mind that can offset any benefit to being right). If I ever do decide to take this step, I will communicate further on how it will be implemented and of course give all clients the opportunity to ask any questions and express any concerns. What I think is far more important than worrying about this sort of situation is making sure that your asset allocation is reasonable for your financial goals, that you can handle the downside risk without being scared when that risk becomes a reality, and that the upside returns target the returns you need to achieve your goals. Along those lines, after bashing stock market predictions earlier in this message, I’ll end it with two of my own. First, sometime in the next 50 years, the stock market is going to lose at least half of its value over a very short period of time. It might have started yesterday. It might start two decades from now. But, it’s inevitably going to happen. Don’t let the good times lure you into risking money you can’t afford to risk in the stock market. We use bonds and other asset classes for short-term goals because of their safety. We use cash for emergency funds because of the liquidity it provides. We can target an overall asset allocation that gives the best chance of hitting your goals regardless of what the stock market does, but we can’t be greedy and gamble for high returns over the short-term. Second, unless the world comes to a brutal end in some cataclysmic event that would make money useless anyway, the stock market will be much higher 50 years from now than it is today. A dollar invested in the S&P 500 in 1963 would be worth $116 today. That’s despite losing 10% in 1966, more than 42% in 1973-74, almost 50% from late 2000 to early 2003, and almost 60% from late 2007 to early 2009. Amazingly, even a dollar invested at the peak in Oct 2007 would be worth $1.47 today, almost a 50% return. Don’t let fear of the market falling tomorrow stop you from investing for the long-term today. There is no upside to hoarding cash, especially when it earns less than the rate of inflation like it does today. Stick to your plan in the good times and the bad, and always remember that there will be more of both in the future.

Here We Go Again… But Not Quite

As you all know by now, there’s a chance that the Federal government will be shut down as of midnight tonight due to lack of authority to fund it. This lack of authority comes from the fact that there is no budget and the law that allows Congress to temporarily continue to spend without a budget (known as the Continuing Resolution) is expiring. Just to be clear, markets continue to provide the Federal government with virtually any amount of financing they want/need to run the country. Obtaining money IS NOT an issue. This shutdown would be strictly due to Congress’s inability to pass a law to permit themselves to continue to spend money. It really is silly, no matter what side of the aisle one supports, but it’s the way our country works.

I’m not as confident in this getting resolved in time as I was in the Fiscal Cliff getting resolved at the 11th hour last year. However, here we’re not talking about laws that would dramatically change without action as we were with the Fiscal Cliff. We’re talking about the Federal government’s ability to perform its non-essential tasks temporarily. They’ve already indicated that all essential tasks, including those related to public safety, will go on even without a Continuing Resolution. The government has shut down numerous times in the past with negligible impact (to the point that most people don’t even remember the prior shutdowns). As long as a Continuing Resolution is passed at some point in the next few days or even weeks, there will be little to no lasting impact beyond the clear demonstration to the world, to businesses, and to individuals that our government has become inept.

Coming up shortly after this Continuing Resolution debate will be the Debt Ceiling debate. On or around October 17th, the Treasury will hit the current legal debt limit and will be unable to borrow money to fund the operation of the government and, more importantly, to make interest payments on its outstanding debt. Again, a government shutdown probably wouldn’t have a big impact as long as it only temporarily impacts non-essential services. Missing an interest payment, however, would have serious ramifications to the economy and global financial markets. In the order of increasing impact hitting the Debt Ceiling would:

  • Threaten the full faith and credit of the United States as lenders may consider the fact that we don’t make timely payments on our debt and may hesitate to lend us money in the future or demand higher interest rates in order to lend that money. I’d say this is a fairly small issue overall, as the U.S. Dollar / U.S. Treasuries are still going to be considered the strongest and safest place to put money.
  • Indicate how dysfunctional our government has become when it comes to problem solving, perhaps threatening confidence in U.S. growth and long-term solvency, especially considering the fiscal issues that need to get resolved in the coming years (Social Security and Medicare for example). This could definitely has some impact over our ability to borrow at low rates in the future.
  • Mean a technical default on our debt. While this seems the most trivial of all, especially knowing that it would only be temporary, this is the biggest issue because of all the derivative securities like credit default swaps (CDS) that are outstanding on U.S. debt. CDS are essentially insurance contracts that state that if a particular debt instrument defaults, the CDS would pay out a fixed amount as insurance against that default. A default on US Treasuries that is caused by a missed interest payment, no matter how temporary and technical in nature, would likely trigger at least some of those contracts to pay out. CDS are a highly unregulated part of the financial markets and there’s no telling how many of these contracts have been written and who’s on the hook for making payments in the event of a default. It is highly likely that some financial institutions would have to make large enough payments that they could fail. This is virtually the same problem that occurred with the ’07-’08 financial crisis and could result in a repeat of fallout we saw from Bear Sterns, Lehman, and AIG falling apart at that time.

Because of the severity of the impact of hitting the debt ceiling, it’s obviously a much bigger issue than the government shutdown that may begin tomorrow. Markets have started to react. They are pricing in the fair probability but relatively small effect of a government shutdown. They’re also starting to price in the very low (but not zero) possibility of hitting the Debt Ceiling in a few weeks (if we can’t solve the simple issue of the Continuing Resolution, it must mean that there’s an increased chance of not being able to solve something more complicated like the debt limit… that’s how the markets look at this). Regardless of what happens tonight, tomorrow, and in the coming days around keeping the government running, I’m very confident that the debt ceiling issue will be resolved in some manner without a default. Market will be volatile (down and up) over the next few weeks. A game of chicken in Congress will develop. Nothing will get resolved until it absolutely has too. Those are virtual certainties. What’s also certain, despite what the media will present over the next several hours, is that life will go on tomorrow with or without non-essential services from the Federal government.

Congress needs to get its act together. However, it doesn’t need to do it tonight. That lack of urgency, despite media representations, is what very well might prevent them from getting it together tonight. High media interest in something that really isn’t a crisis is the perfect opportunity for grandstanding and that’s what it looks like we’re getting.

Market Update 6/20/13

The Federal Reserve is eventually going to stop firing their Monetary Bazooka (“QE”, as its commonly known). We’ve always known that. Over the last month, culminating in yesterday’s post-FOMC announcement press conference, “eventually” became “soon”. Despite reiterating their promise to keep short-term interest rates near-zero into 2015, their plan to continue to QE program through mid-2014, and their resolve to support the economy through aggressive monetary policy for as long as it needs their support, the Fed has spooked the market by signaling the beginning of the end of monetary stimulus. First, let’s quantify the damage:

There are other factors at work as well including Japan’s unprecedented attempt to stimulate its economy through QE (makes ours look like child’s play) and the currency fluctuations that has caused, China attempting to pop its real estate bubble by extracting stimulus and causing domestic bank liquidity issues, recent protests in Turkey and Brazil, ongoing political instability in Syria, Egypt, and much of the rest of the middle east, inflation in India, Brazil, and some of the other emerging markets, massive unemployment and fiscal issues in southern Europe (Portugal, Italy, Greece, Spain, Cypress) while debating between austerity and trying to stimulate growth. I don’t want to minimize them, but here I want to focus on the Fed, which is really the only change in the past two days. Clearly, from the table above, there hasn’t been anywhere to hide but emerging markets have really taken the biggest beating as expected since they are typically the most volatile asset class.

In addition, mortgage rates have started to rise, following treasury rates. 30-year fixed rates have moved from 3.3% in May to an average of 3.93% last week according to Freddie Mac’s weekly survey, and likely well over 4% this week. Continued increases in mortgage rates will hurt the housing market which has been in full recovery mode for last 18-months and is the prime reason behind the economy’s strengthening.

So, should you be worried? I would be worried if any of the following are true:

1) If my financial plan was built on an expectation that I’d be able to borrow at absurdly low rates forever. I’ve been building 4.5% rates in for the near term and 6-7% rates for 2015 and beyond into all client plans. Higher rates are unfortunate, especially if you’re hoping to buy a home soon, but rates are still within the tolerances of your plan. It’s important to note also that if rates move much higher over the short-term, prices will most likely come down as buyers simply won’t be able to afford the higher monthly payment that comes along with higher rates on the same amount borrowed. In hot markets like the SF bay area, higher rates, if matched by an expected increase in supply thanks to higher prices, could stop the housing recovery in its tracks.

2) If my financial plan was built on an expectation that my investment portfolio would only go up, day-after-day, with no volatility forever. If you believe that’s possible, you haven’t been listening to anything I’ve said or written in the past. No portfolio (except maybe Bernie Madoff’s) will do that and your financial plan certain doesn’t have that expectation built in if I helped to create it. We’ve seen stocks relentlessly increasing since March 2009 and have to expect pullbacks / corrections from time to time. It’s the price you pay as an investor for the reward of higher long-term gains. As a general rule of thumb, you have to be prepared to lose 50% of the portion of your portfolio that’s in the stock market in any downturn. If you’re 50% stock / 50% bond, that means a 25% loss can be expected at some point (it’s happened twice in the last 13 years). As I’ve said before, if you’re uncomfortable with the potential for loss, then you must be more conservative and must accept lower long-term return expectations. There’s no way around this point.

3) If I was invested only in stocks and long-term bonds for my short-term goals and I needed every dollar I had invested for those goals. I coach all clients to invest conservatively for short-term goals, in some cases extremely conservatively, and to maintain cash for ultra short-term goals where you need every dollar you have. I’m not using long-term bonds in any client portfolios, favoring shorter-durations which will fare better in a slowly rising rate environment.

4) If I was investing for long-term goals primarily in stocks, but couldn’t get past short-term results, even though they don’t matter over the long-term. This one is psychological, but is key. Unless you think you have a crystal ball that can predict the short-term future of the markets, you just have to accept the short-term in favor of higher expected long-term returns. Hopefully you’re all on board. If you’re not, investing may not be for you.

5) If I hadn’t communicated my goals and plans with my financial advisor, or if I didn’t have a financial plan at all. Here’s there’s room for worry if things have changed in your life, you’re a PWA-client, and you haven’t communicated those changes or kept up with your annual reviews, or if you’ve never completed or kept up with a financial plan to begin with. To quote Yogi Berra as I’ve done in past posts, “If you don’t know where you’re going, you might wind up someplace else”. A similar result can be expected if you haven’t told your financial advisor where you’d like to go!

On the flip side, instead of worrying, remember that a falling market creates opportunity as long as you continue to add to your portfolio. You’ll be much better off with some dips along the way to your goal than you would in a straight line where the market only goes up, counter-intuitive as that might seem.

With all of the above said, perhaps some of you are still worried that rates are going to soar, the market is going to plunge into an abyss, and we’re headed for the Great Depression v2.0. After all, the real danger in unstable markets is the circular feedback loop that they have on the economy and that the economy has on the market. If asset prices irrationally fall, consumer and corporate confidence tends to fall too, which can slow the economy and cause asset prices to fall. Normally, this kind of feedback loop has the potential to cause a catastrophic downward spiral where fear begets fear and markets crash. If the Fed was stepping away and saying, “we’ve done all we can”, I’d worry about that too. In this case though, the Fed hasn’t stepped away from the market. They haven’t taken the training wheels off the bike, given the child a push, and turned their back. They’ve told that precious child that they’re going to take the training wheels off when she’s mature enough and steady enough and they’re monitoring that regularly. When they do, they’ll be there running along with the bike keeping it steady until it has picked up enough speed that she can balance and pedal without falling. And, if by some chance she falls off that bike even with all the support, they may put the training wheels back on again, repair the damage, and try again later. Yep, there may be crying, there may be a sleepless night or two, there may be a scraped knee, but she’ll make it. There may be short-term dislocations in the market as selling causes margin calls which leads to more selling temporarily, but the economy and the markets will make it as well.

To summarize, don’t worry unless you don’t have a plan or you haven’t communicated your goals to your financial advisor. Market volatility is both normal, and even helpful over the long-term. Finally, realize that the Fed hasn’t spent 6 years trying to get the economy back in working order only to walk away and let it crash now.

Fiscal Cliff Update

Reporters are already beating this story to death, but I wanted to provide a quick update from my perspective. Going over the Fiscal Cliff means higher taxes for all via the expiration of the 2001 and 2003 tax cuts, and forced spending cuts via the sequestration that was agreed upon during the debt ceiling debacle last year. We will technically go over the cliff on Jan 1 if Congress and the President don’t pass a law to extend the tax cuts and/or modify the sequestration. By now, everyone knows that. Ultimately, the “answer” is not to perpetually extend tax cuts and keep spending more than we can afford. But, the idea is to extend some of the tax cuts and some of the spending until the economy is back on its feet while setting the stage for major tax and entitlement reform in 2013/2014.

What isn’t as readily apparent is that virtually everything that changes if we go over the cliff can be modified retroactive to Jan 1. I hate to get into politics on this blog, but there seems to be a substantial incentive to go over the cliff, or come as close to it as possible, and then to place blame on the other party for doing so while each party is able to appeal to its base for sticking to its guns. Speaker Boehner’s re-election vote is on Jan 3 and the odds of re-election are thought to be higher if he stands his ground, consistent with the motivation for each party to obstruct progress and issue blame. Then, post Jan 1, after payroll systems are at the deadline for change to charge higher taxes, markets are on edge, constituents are threating to stop funding Congressional election campaigns, etc., a deal can be reached without losing face.

Whether a minor deal is passed on 12/31 or in early January is not relevant (2012 AMT exemption aside – this will almost certainly get passed). What is relevant is avoiding a traumatic shock to the economy and laying the groundwork for long-term reform, at least far enough to prevent another debt downgrade, and prevent the market from demanding higher interest rates in order to lend money to the US government. It’s hard to have faith in government at this point. But, as Winston Churchill supposedly once pointed out, you can always trust Americans to do the right thing once all other possibilities have been exhausted. I believe we’re getting close to that exhaustion.

One more thing… a CNBC commentator recently drew a parallel between Congress’s fiscal cliff actions and term paper deadlines saying, “Did you ever turned in a term paper ahead of its deadline?” Of course the answer for virtually everyone is a resounding “No”. Congress acts similarly. However, I think this is a little different. This is like a term paper where you’re penalized one point for every day late. If the deadline is 12/31, you would be tempted to miss the deadline by a few days, but would be unlikely to never turn in the paper. Even though the incentive to turn it in on any particular day is fairly low and you might be ok with losing a few points, there comes a time where you start to add up the damage, sit down at your computer, and just get it done. Damage will be done to the economy and to confidence each day that passes beyond 12/31, but it’s important to note that we’re not going to immediately get an “F” or fall off a cliff into the abyss, despite claims from ratings-hungry reporters. Markets will get antsy, reporting will get ugly, and the political blame game will be enhanced to its highest level yet. But, as long the short-term is handled in the next few weeks and the long-term is handled in the next few years, this crisis will pass like all others before it.

Have a Happy New Year. The Mayan’s couldn’t take it away and neither will the Politicians.