Q2 2022 Returns By Asset Class

This post contains the usual returns by asset class for this past quarter (by representative ETF), year-to-date, last 12 months, last five years, last ten years, and since the covid low (3/23/2020).  While there is still no predictive power in this data, I’ll continue to post this quarterly for those of you that are interested. 

Last Quarter (4/1/22-6/30/22)
Year-To-Date (1/1/22-6/30/22)
Last 12 Months (7/1/21-6/30/22)
Since Covid Low (3/23/20-6/30/22)
Last 5 Years (7/1/17-6/30/22)
Last 10 Years (7/1/12-6/30/22)

A few notes:

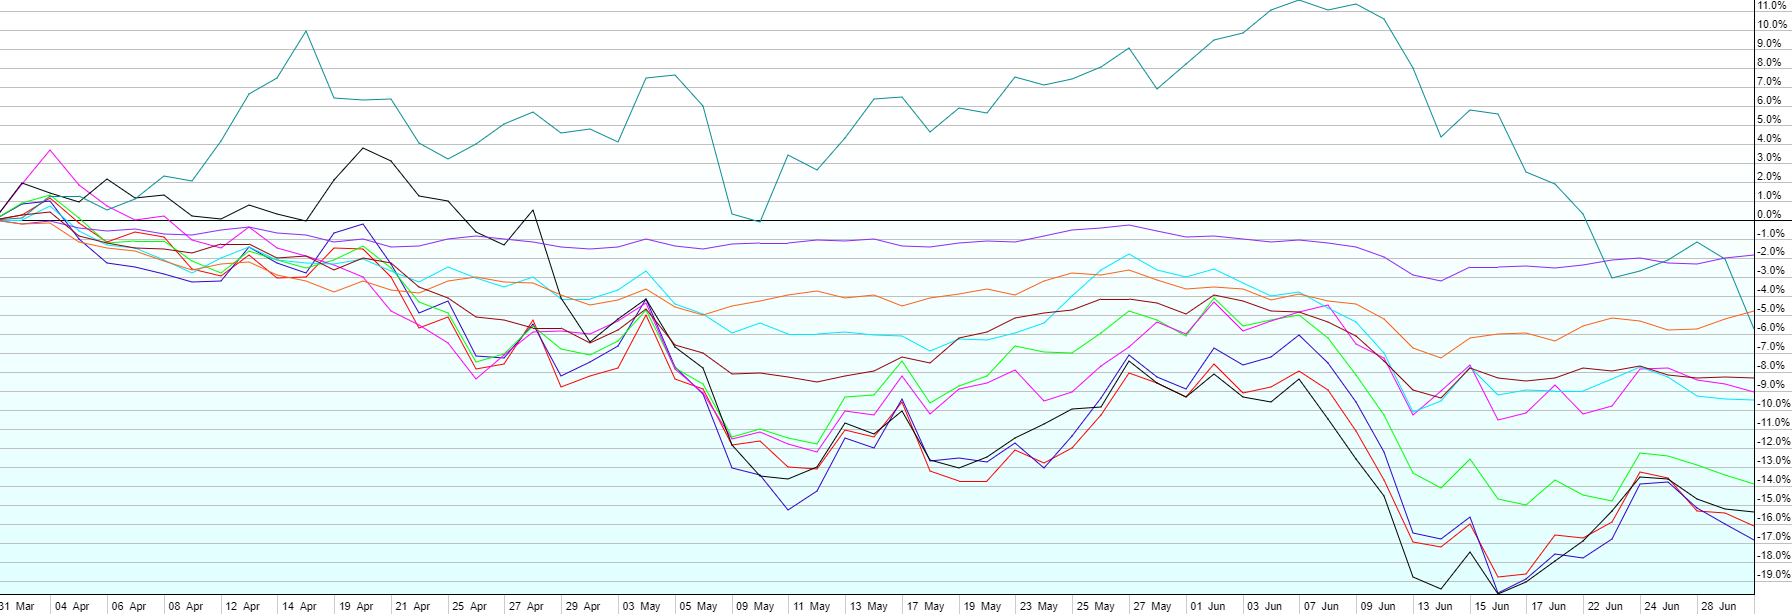
  • Q2 was an awful quarter for stocks across the board. Emerging markets performed best out of the major asset classes (-9%), with foreign developed (-14%), US REITs (-15%), US Large Cap (-16%), and US Small Cap (-17%) lagging behind. Continued interest rate hikes by the Federal Reserve to battle continued increases in inflation have pressured asset values and sparked fears of a sharp economic slowdown as a result. Whether we’re technically in a recession now (two consecutive quarters of negative GDP growth) or not, it’s clear that the Fed is determined to slow inflation at all costs right now, both by raising rates and via Quantitative Tightening (QT), or selling assets from their balance sheet.
  • Bonds had another tough quarter too in Q2. Long-term treasuries (TLT, not shown above) were down 13% in the quarter, now down 22% YTD as rates spiked, and prices (which are inversely correlated with rates) sank. We generally keep the bond side of client portfolios much shorter in duration, and include inflation-protected bonds, both of which faired much better again. Short-term inflation protected treasuries were only down 1.2% for the quarter., with short-term investment-grade credit down 1%.
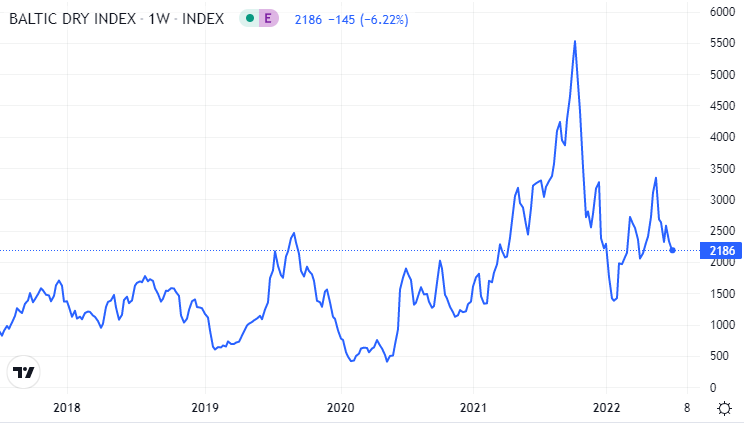
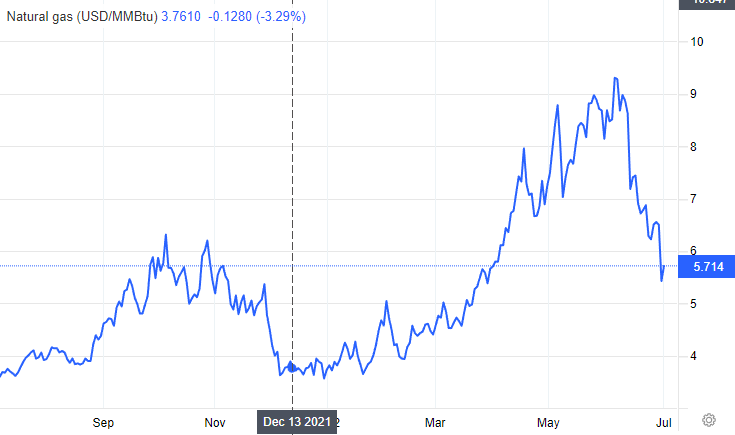
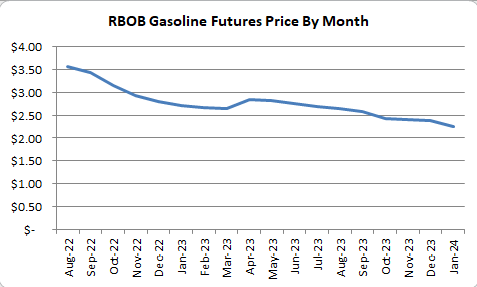
  • Even commodities turned in negative performance for Q2. After being up as much as 11% for the quarter in early June, a sharp downturn across the board, and especially in energy delivered a -6% quarter.
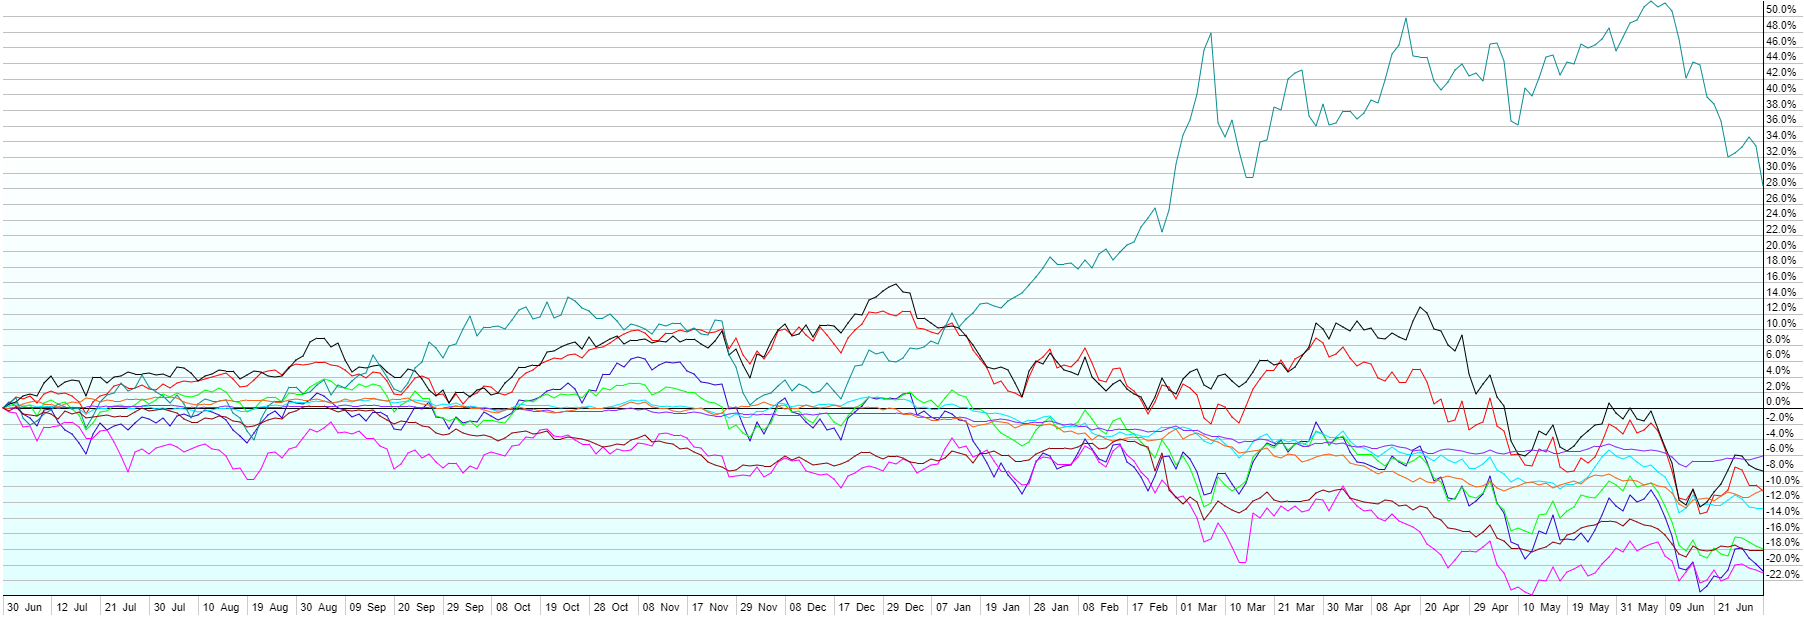
  • The worst performing areas of the market in Q2 were the same as in Q1. The ARK Innovation ETF (ARKK), down almost 30% in Q1, tumbled another 40% in Q2, and is now down almost 75% from its 2021 peak. On the flip side, US value stocks are still holding up relatively well, down only 9% YTD vs. the S&P 500’s -20%.
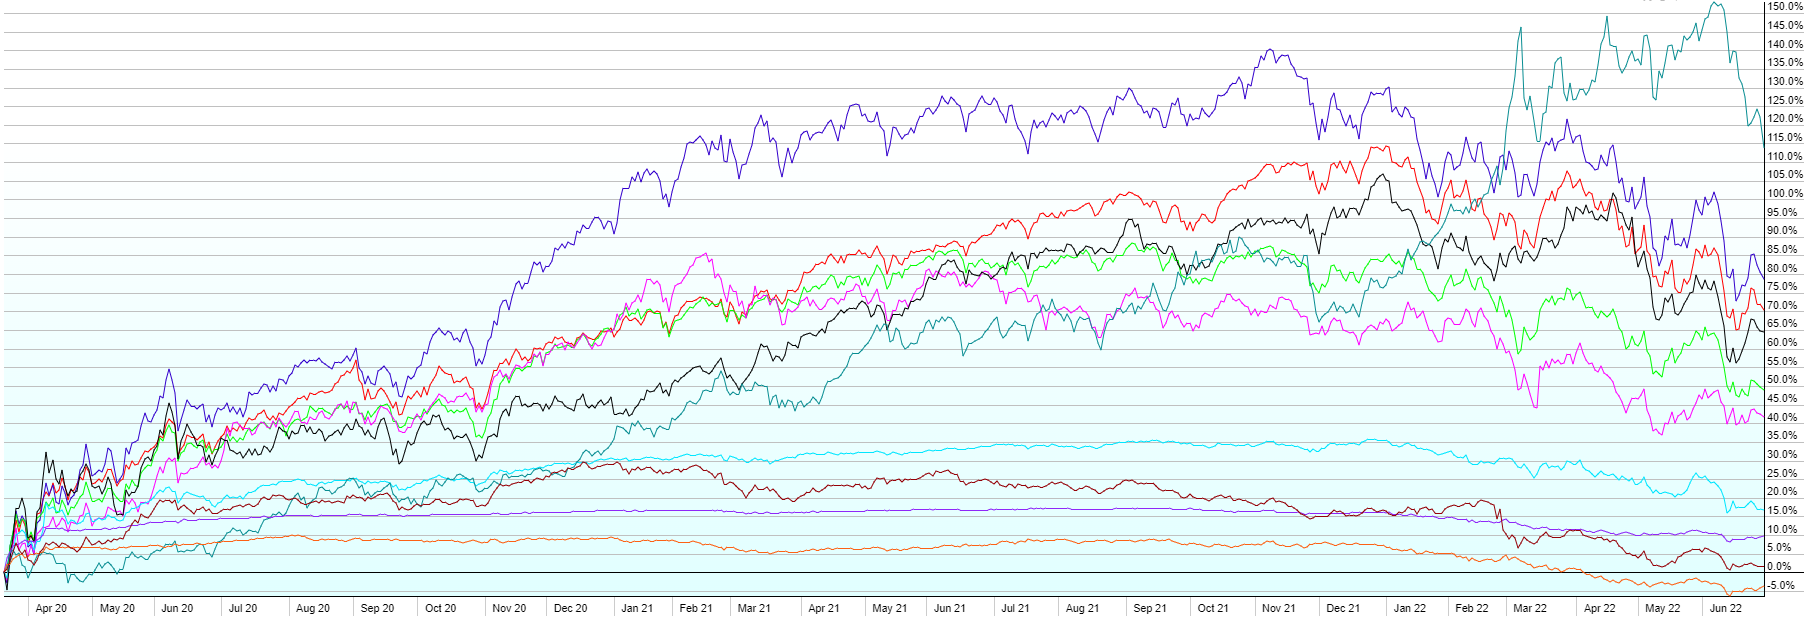
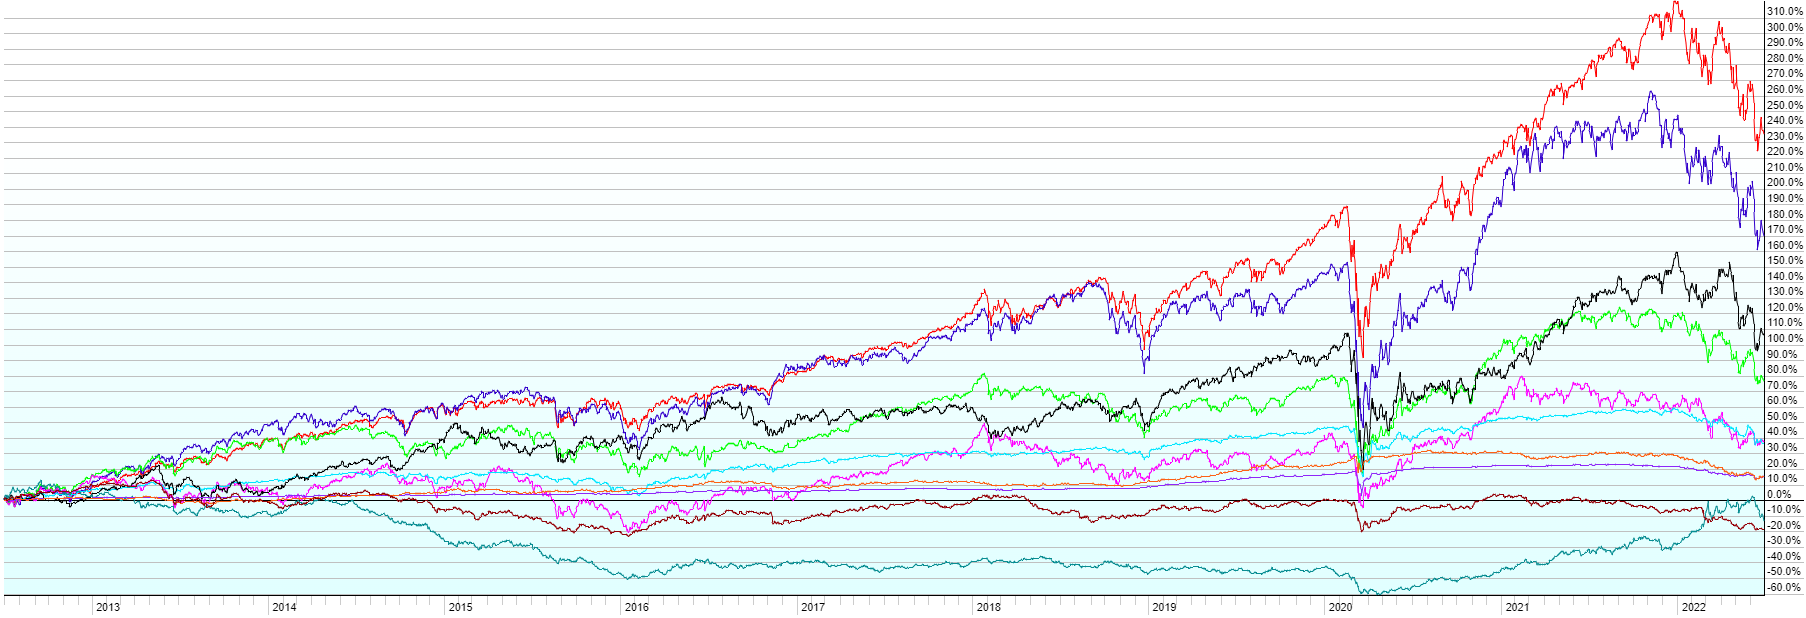
  • Markets in general are still sharply up from the 2020 Covid lows and over the last 5 and 10 years. US Large and Small Caps have dominated global performance over the last decade.

Has Inflation Peaked?

As I’ve wrote back in May, inflation, leading to higher interest rates, leading to fear of a sharp economic slowdown, seems to be dominating stock/bond market performance of late (and not in a good way). I’ve been seeing some signs of inflation cooling of late and wanted to share a few, because you generally don’t get early/good signs of stuff like this on the news. Remember though, it’s very doubtful that overall prices will ever come back down to where they were. What’s were looking for is the increase in prices going forward to moderate back toward 2% per year. Below are some signs of actual price moderation, which would likely start to flow through the economy and ease the rate of growth of other prices. Has inflation peaked? No one has a crystal ball, but I’d say the below charts are a good sign for the short-term.

1) Baltic Dry Index – benchmark for the price of moving the major raw materials by sea. Moderating after the huge spike in late 2021.

Source: Trading Economics

2) US Natural Gas – a heavy input into the price of electricity in the US. Sharp decline from recent peak as exporting to Europe has been disrupted by facility issues.

Source: Trading Economics

3) Total Homes Currently For Sale – rising sharply after hitting all-time low levels that drove up prices over the last year. When combined with higher mortgage rates, this should slow down an overheated housing market.

4) Lumber – key input into new home construction costs, down over 60% from 2021 peak and more than 50% from winter 2022 just a few months ago.

Source: Nasdaq

5a) Gasoline Futures (RBOB) – we all know prices at the pump are a LOT higher over the past few months, but the price of gasoline futures is down pretty sharply from peak a few weeks ago. That takes a while to filter through the system since prices come down only a cent or two per day via competition between stations. But it’s a good sign. The current front month futures price of $3.55/gallon would generally translate to ~$4.35 national average at the pump.

Source: Nasdaq

5b) Gasoline Futures (RBOB) – In addition to the front month futures contract trending down, the shape of the futures curve is also down with Jan 2023 down to $2.70/gallon and Dec 2024 all the way down to $2.25.

Source: Chicago Mercantile Exchange

6) 5-year Breakeven Inflation Rate – by comparing the interest rate on Inflation Protected Treasuries (TIPS) vs. Non-Inflation-Protected Treasuries, we can estimate the inflation rate that the market has priced in over the next 5 years on average. After rising considerably (though still nowhere near the current 8%+ / year actual levels, the breakeven rate has fallen and is getting closer to the Fed’s comfort range ~2%.

Source: St. Louis Fed (FRED)

So maybe, just maybe, we’ve seen the worst, at least for the short-term. Much depends on both controllable factors like policy responses (hint: cutting the gas tax and handing out cash aren’t going to help increase supply or decrease demand) as well as non-controllable factors like the war in Ukraine. (global energy and food supplies this winter are going to be tight). Even if food/energy inflation stays high, if the “core” inflation moderates, it will give the Fed room to be a bit more dovish, and that’s likely to be taken positively by the financial markets.