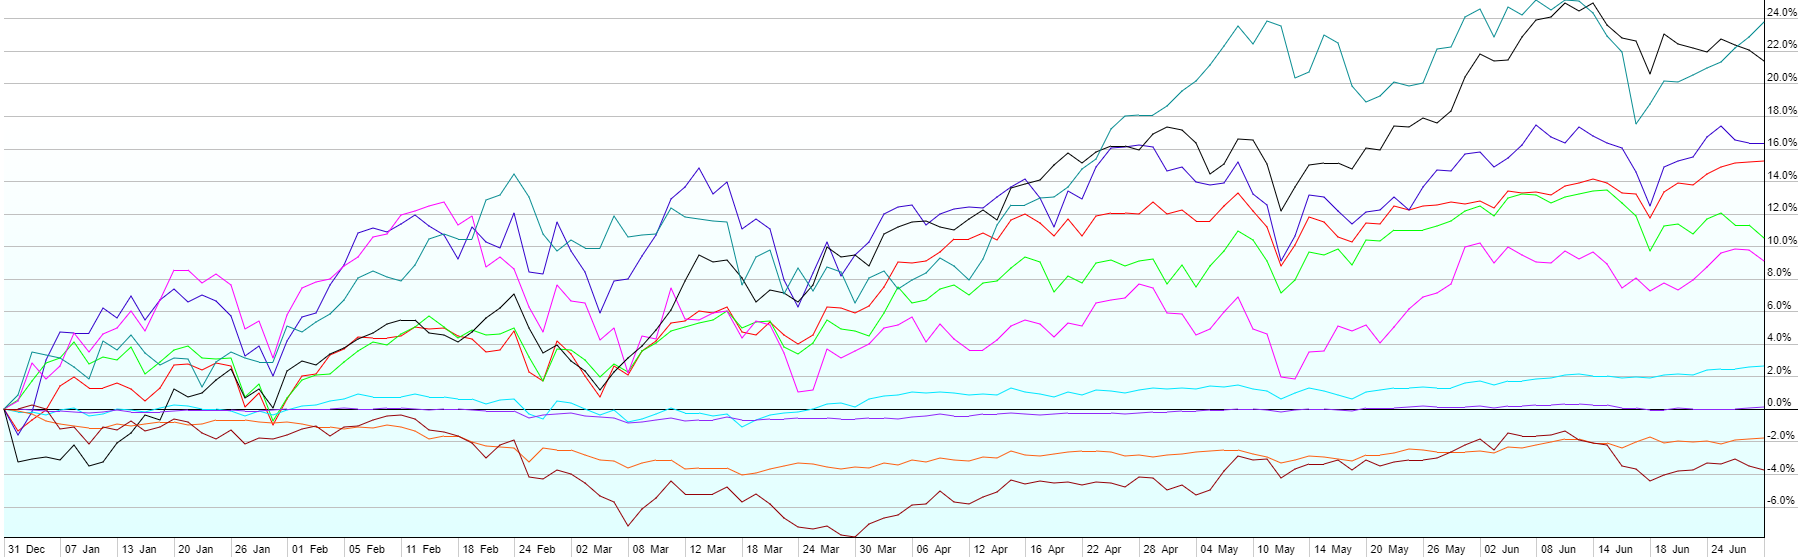
This post contains the usual returns by asset class for this past quarter (by representative ETF), year-to-date, last twelve months, last five years, last 10 years, and since the covid low (3/23/2020). While there is still no predictive power in this data, I’ll continue to post this quarterly for those of you that are interested.


A few notes:
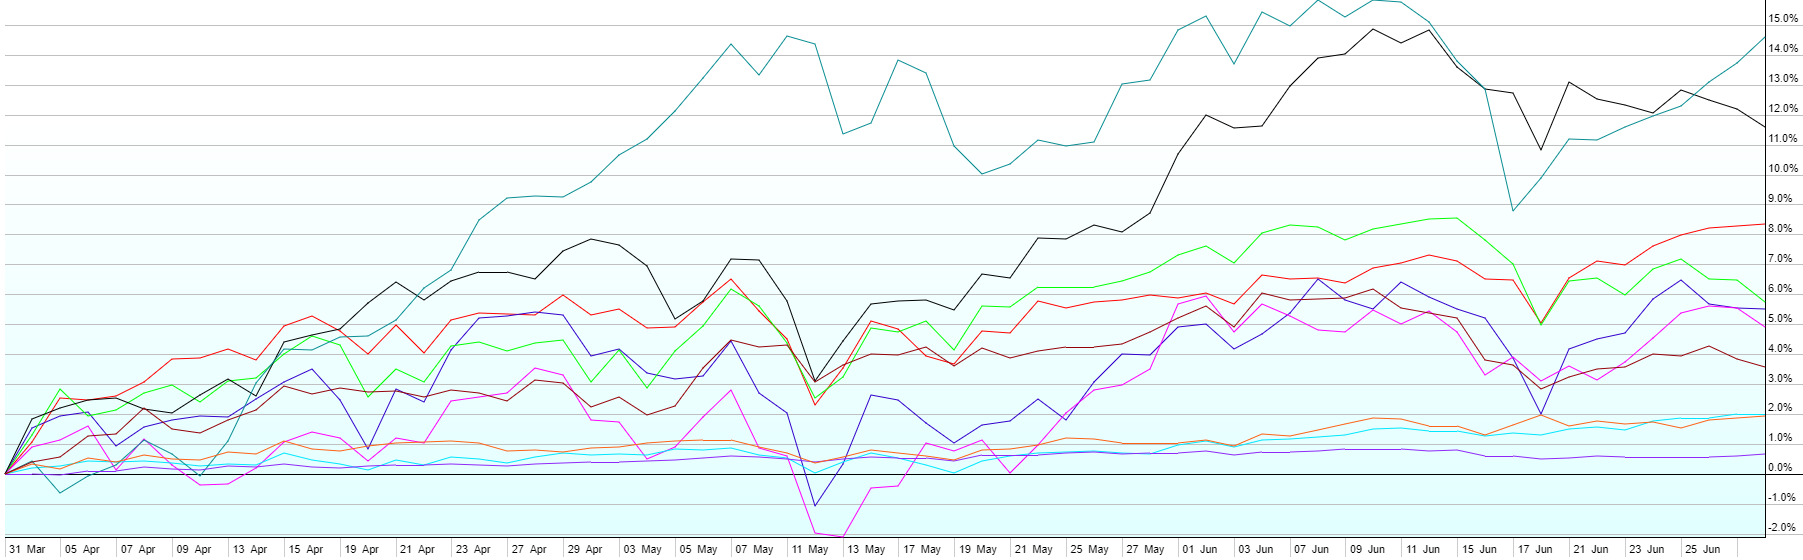
- Another solid quarter in Q2 for all assets classes. Commodities led the way (+15%) as the world got a strong whip of inflation. Whether that’s transitory as the Fed expects or not, remains to be seen. Real Estate Investment Trusts (REITs) (+12%) were close behind. US Large Cap (+8%), Foreign Developed (+6%), US Small Caps (+5%) and Emerging Markets (+5%) also had great quarters. Emerging Market Bonds (+4%) were the winners in fixed income, with High Yield (+2%), US Aggregate Bonds (+2%), and Short-Term Corporate Bonds (+1%) close behind. Treasury Inflation Protected Bonds (not shown on the charts) were +3% in the quarter, again on the back of higher consumer prices.
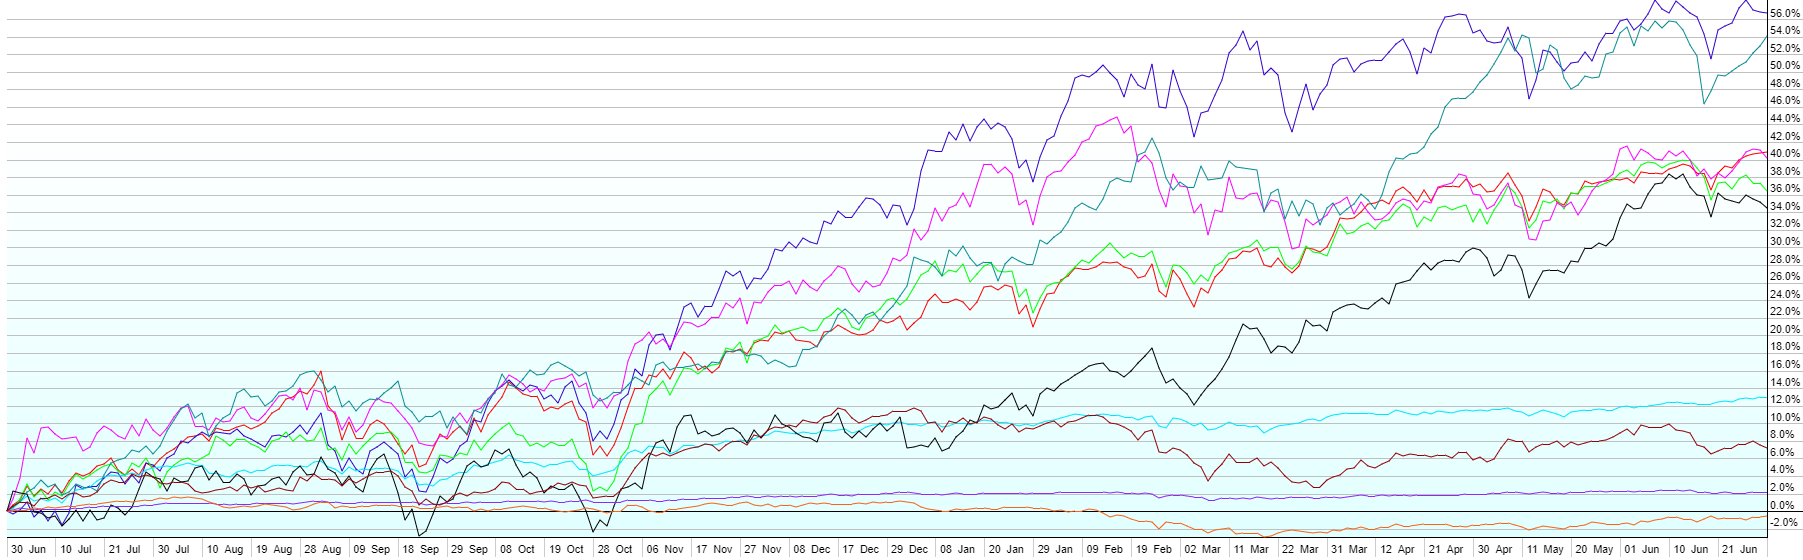
- While commodities have roared back over the last year, the 5 and 10-year charts show just how far they’ve lagged behind other asset classes. Commodities generally track inflation over the long-term, and they really suffered after the financial crisis, the oil glut, and the early part of covid.
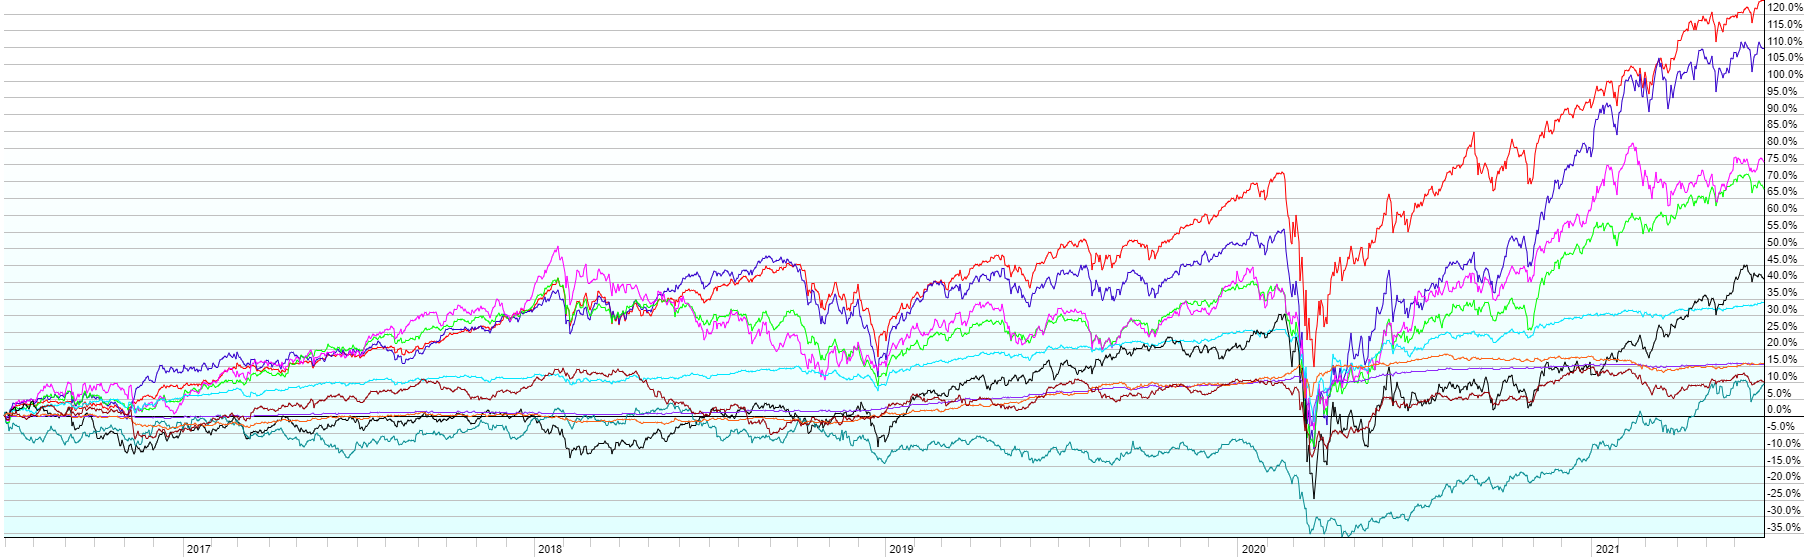
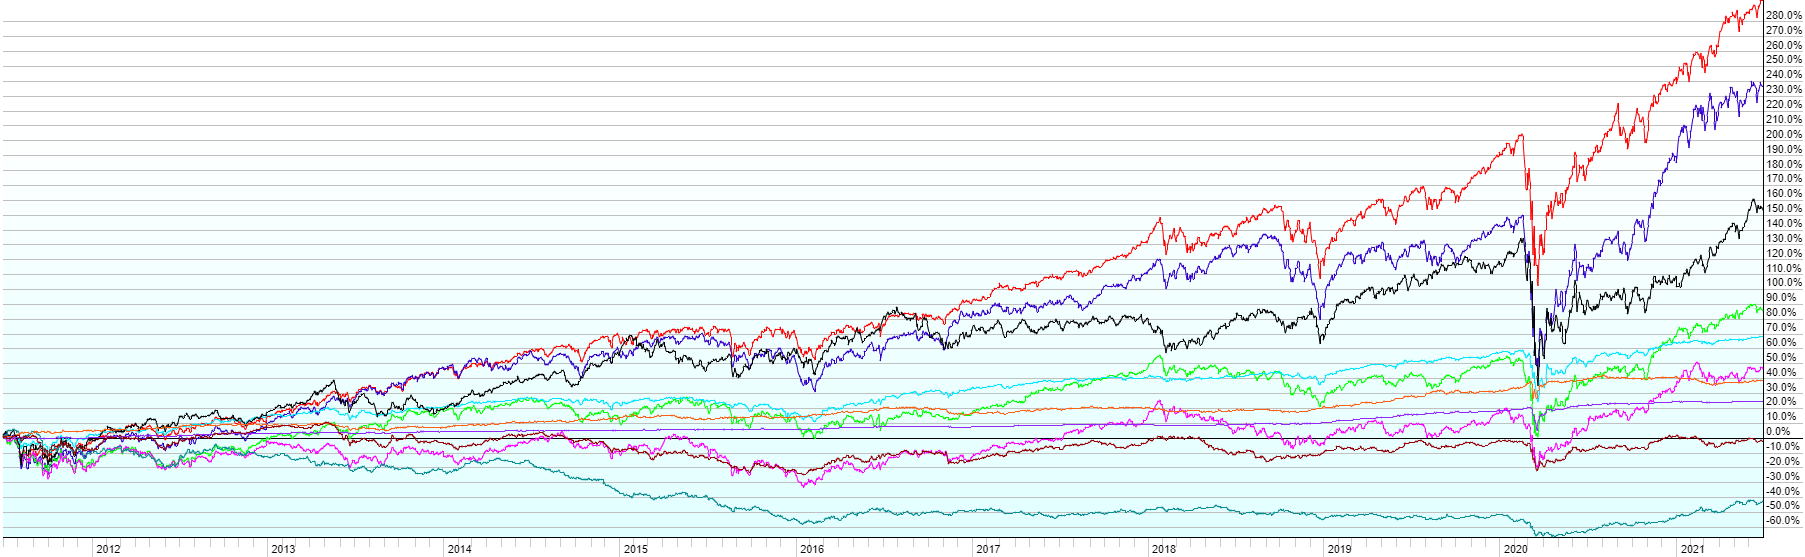
- All assets classes have shown positive returns since 3/23/20 (the Covid low), amidst the worst pandemic in a century. US Small Caps are now up 130%+ over that period, dominating the other asset classes. Just about the time that the world was assuming the worst and fearing the most as lockdowns started in the US, the bottom was in for the financial markets. Yet another, among numerous historical examples, of why it doesn’t make sense to sell in the midst of a crisis, no matter how bad it looks.
