This post contains the usual returns by asset class for this past quarter (by representative ETF), year-to-date, last 12 months, last five years, last ten years, and since the covid low (3/23/2020). While there is still no predictive power in this data, I’ll continue to post this quarterly for those of you that are interested.


A few notes:
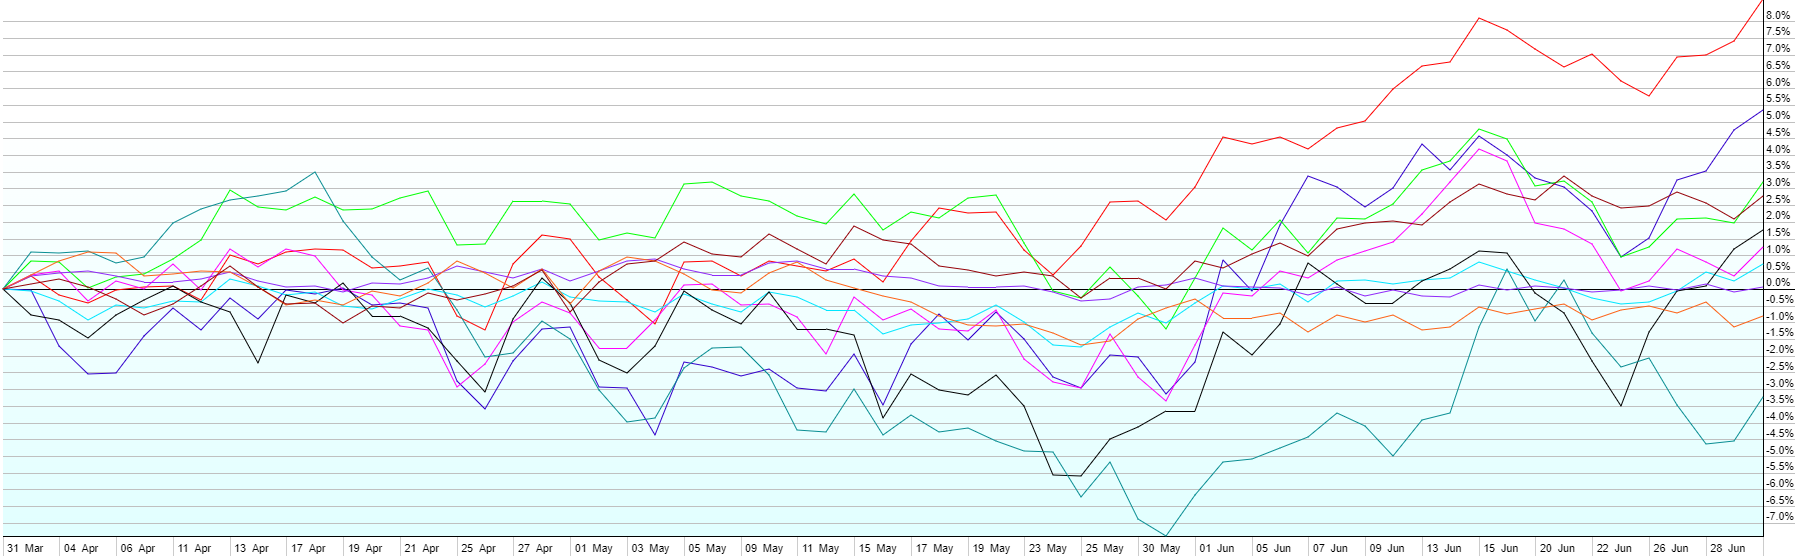
- With jobless claims rising for most of the quarter, softness in many economic indicators, core inflation still running stubbornly hot, and the Fed once again increasing its expectation for further rate hikes (despite a pause at their last meeting), one would think Q2 would have been a messy quarter for stocks. However, just the opposite happened, once again, causing pain for those that think they can time the stock market.
- US Large Cap stocks (+8.7%) led the way in Q2, with Large Cap Tech outperforming the asset class as a whole. Artificial Intelligence (“AI”) was the buzz word of the quarter after phenomenal earnings from Nvidia (NASD: NVDA), a leader in the space and the continued rise of ChatGPT and other AI chatbots into everyday life. While the growth in that space overall should be phenomenal, valuations are a major concern with stocks like NVDA. US Small Caps (+5.3%) took second place in Q2, followed by International Developed (+3.2%) and Local Currency Emerging Market Bonds (+2.8%). REITs finished up 1.8%, Emerging Market Stocks up 1.2%, High-Yield Bonds up 0.8%, and Short-Term Corporate Bonds were essentially flat (+0.1%). On the downside this quarter were US Aggregate Bonds (-0.8%) as interest rates were once again higher and Commodities (-3.2%), perhaps giving an indication that inflation is coming down despite being stubbornly high for the last year.
- Not shown in the charts above, but growth outperformed value again in Q2. Speculative areas of the market have been heating up in 2023 after getting clobbered in 2022.
- While the S&P 500 is now up 15% year-to-date on a price basis, the equal weight S&P 500 is only up 6%. That’s an indication that 2023’s rally thus far has been led by a select group of stocks and while breadth was slightly better during parts of Q2, the average stock is up far less than the market cap weighted indexes are. Also of note this quarter, Apple’s (NASD: AAPL) market cap topped $3 Trillion (yes, with a “T”), the first stock to accomplish that feat.
