The Federal Reserve is eventually going to stop firing their Monetary Bazooka (“QE”, as its commonly known). We’ve always known that. Over the last month, culminating in yesterday’s post-FOMC announcement press conference, “eventually” became “soon”. Despite reiterating their promise to keep short-term interest rates near-zero into 2015, their plan to continue to QE program through mid-2014, and their resolve to support the economy through aggressive monetary policy for as long as it needs their support, the Fed has spooked the market by signaling the beginning of the end of monetary stimulus. First, let’s quantify the damage:

There are other factors at work as well including Japan’s unprecedented attempt to stimulate its economy through QE (makes ours look like child’s play) and the currency fluctuations that has caused, China attempting to pop its real estate bubble by extracting stimulus and causing domestic bank liquidity issues, recent protests in Turkey and Brazil, ongoing political instability in Syria, Egypt, and much of the rest of the middle east, inflation in India, Brazil, and some of the other emerging markets, massive unemployment and fiscal issues in southern Europe (Portugal, Italy, Greece, Spain, Cypress) while debating between austerity and trying to stimulate growth. I don’t want to minimize them, but here I want to focus on the Fed, which is really the only change in the past two days. Clearly, from the table above, there hasn’t been anywhere to hide but emerging markets have really taken the biggest beating as expected since they are typically the most volatile asset class.
In addition, mortgage rates have started to rise, following treasury rates. 30-year fixed rates have moved from 3.3% in May to an average of 3.93% last week according to Freddie Mac’s weekly survey, and likely well over 4% this week. Continued increases in mortgage rates will hurt the housing market which has been in full recovery mode for last 18-months and is the prime reason behind the economy’s strengthening.
So, should you be worried? I would be worried if any of the following are true:
1) If my financial plan was built on an expectation that I’d be able to borrow at absurdly low rates forever. I’ve been building 4.5% rates in for the near term and 6-7% rates for 2015 and beyond into all client plans. Higher rates are unfortunate, especially if you’re hoping to buy a home soon, but rates are still within the tolerances of your plan. It’s important to note also that if rates move much higher over the short-term, prices will most likely come down as buyers simply won’t be able to afford the higher monthly payment that comes along with higher rates on the same amount borrowed. In hot markets like the SF bay area, higher rates, if matched by an expected increase in supply thanks to higher prices, could stop the housing recovery in its tracks.
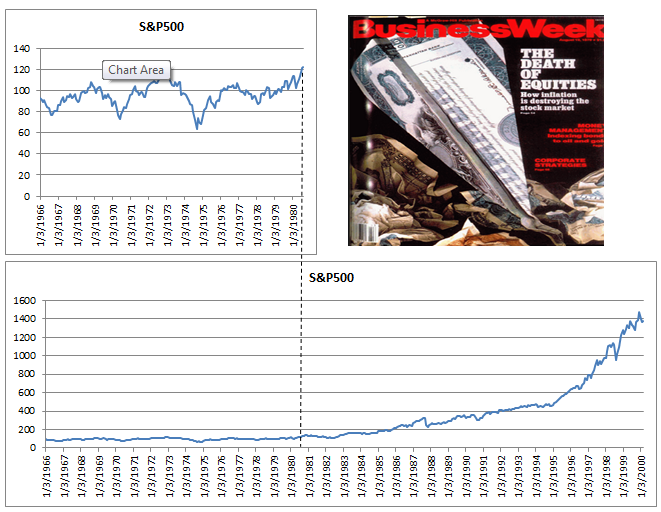
2) If my financial plan was built on an expectation that my investment portfolio would only go up, day-after-day, with no volatility forever. If you believe that’s possible, you haven’t been listening to anything I’ve said or written in the past. No portfolio (except maybe Bernie Madoff’s) will do that and your financial plan certain doesn’t have that expectation built in if I helped to create it. We’ve seen stocks relentlessly increasing since March 2009 and have to expect pullbacks / corrections from time to time. It’s the price you pay as an investor for the reward of higher long-term gains. As a general rule of thumb, you have to be prepared to lose 50% of the portion of your portfolio that’s in the stock market in any downturn. If you’re 50% stock / 50% bond, that means a 25% loss can be expected at some point (it’s happened twice in the last 13 years). As I’ve said before, if you’re uncomfortable with the potential for loss, then you must be more conservative and must accept lower long-term return expectations. There’s no way around this point.
3) If I was invested only in stocks and long-term bonds for my short-term goals and I needed every dollar I had invested for those goals. I coach all clients to invest conservatively for short-term goals, in some cases extremely conservatively, and to maintain cash for ultra short-term goals where you need every dollar you have. I’m not using long-term bonds in any client portfolios, favoring shorter-durations which will fare better in a slowly rising rate environment.
4) If I was investing for long-term goals primarily in stocks, but couldn’t get past short-term results, even though they don’t matter over the long-term. This one is psychological, but is key. Unless you think you have a crystal ball that can predict the short-term future of the markets, you just have to accept the short-term in favor of higher expected long-term returns. Hopefully you’re all on board. If you’re not, investing may not be for you.
5) If I hadn’t communicated my goals and plans with my financial advisor, or if I didn’t have a financial plan at all. Here’s there’s room for worry if things have changed in your life, you’re a PWA-client, and you haven’t communicated those changes or kept up with your annual reviews, or if you’ve never completed or kept up with a financial plan to begin with. To quote Yogi Berra as I’ve done in past posts, “If you don’t know where you’re going, you might wind up someplace else”. A similar result can be expected if you haven’t told your financial advisor where you’d like to go!
On the flip side, instead of worrying, remember that a falling market creates opportunity as long as you continue to add to your portfolio. You’ll be much better off with some dips along the way to your goal than you would in a straight line where the market only goes up, counter-intuitive as that might seem.
With all of the above said, perhaps some of you are still worried that rates are going to soar, the market is going to plunge into an abyss, and we’re headed for the Great Depression v2.0. After all, the real danger in unstable markets is the circular feedback loop that they have on the economy and that the economy has on the market. If asset prices irrationally fall, consumer and corporate confidence tends to fall too, which can slow the economy and cause asset prices to fall. Normally, this kind of feedback loop has the potential to cause a catastrophic downward spiral where fear begets fear and markets crash. If the Fed was stepping away and saying, “we’ve done all we can”, I’d worry about that too. In this case though, the Fed hasn’t stepped away from the market. They haven’t taken the training wheels off the bike, given the child a push, and turned their back. They’ve told that precious child that they’re going to take the training wheels off when she’s mature enough and steady enough and they’re monitoring that regularly. When they do, they’ll be there running along with the bike keeping it steady until it has picked up enough speed that she can balance and pedal without falling. And, if by some chance she falls off that bike even with all the support, they may put the training wheels back on again, repair the damage, and try again later. Yep, there may be crying, there may be a sleepless night or two, there may be a scraped knee, but she’ll make it. There may be short-term dislocations in the market as selling causes margin calls which leads to more selling temporarily, but the economy and the markets will make it as well.
To summarize, don’t worry unless you don’t have a plan or you haven’t communicated your goals to your financial advisor. Market volatility is both normal, and even helpful over the long-term. Finally, realize that the Fed hasn’t spent 6 years trying to get the economy back in working order only to walk away and let it crash now.