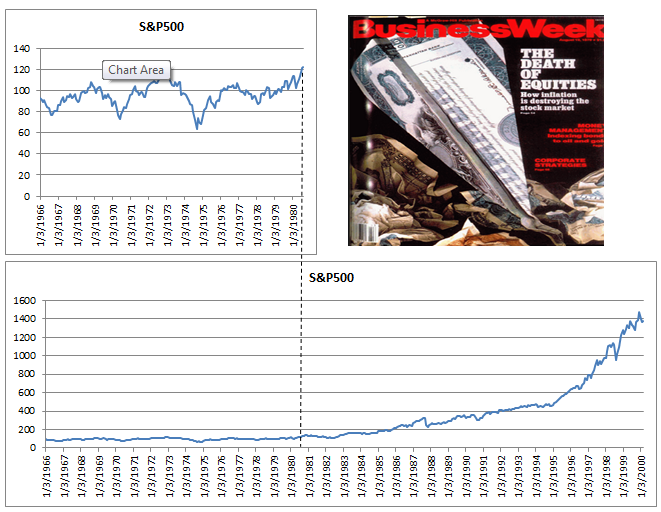
If you watch business news TV, read the business section of the newspaper, or follow business/investing websites, you’ve undoubtedly heard a lot of “due for a pullback”, “too much too fast”, “need a correction” and “not safe to invest at all-time highs” lately. Mind you, many of these predictions started when the stock market was 10-20% lower than it is today. While I continue to believe predicting the short-term direction of the market is a fool’s game, and I’m definitely not saying it’s going to happen this way again, it’s worth looking at the last time in history that the stock market moved essentially sideways for 13-14 years and then broke out to new highs. The first chart below shows the S&P 500 from 1966 to mid-1980. Essentially no gains for over a decade, two massive drops (one near 50%). This was the period of the infamous Businesweek cover that claimed “The Death Of Equities”. The second chart shows the same S&P 500 index starting from the same point, but extending to 2000. If investors were too scared in 1980 to invest in the stock market, or were waiting for a correction to invest because it was breaking to new highs, they may have missed the run from 120 to 1500 on the S&P 500 (1150% return).
The moral of the story is not that you should invest now because the stock market is going to go up for the week, month, year, or decade. It’s that trying to use the recent past (or even 14 years of past) to determine the value of the stock market today is useless. It may even be worse than useless… it could lead you to feel that the market it overvalued, right before it increases 1150% over the longest bull market in history.
