If you own or manage a business in the United States, you may need to comply with new Beneficial Ownership Information (BOI) reporting requirements issued by the Financial Crimes Enforcement Network (FinCEN). These rules, mandated by the Corporate Transparency Act (CTA), are designed to combat financial crimes and improve transparency in business ownership.
Q: What is BOI Reporting?
A: BOI reporting requires certain entities to disclose details about their beneficial owners. Beneficial owners are individuals who directly or indirectly own or control at least 25% of the company or exercise substantial control over it. The information will be maintained by FinCEN in a secure database and used for law enforcement and regulatory purposes.
Q: Who has to file a report?
A: The reporting requirement applies to “reporting companies,” which generally include:
U.S. Corporations, limited liability companies (LLCs), and similar entities typically formed by filing with a US. State’s Secretary of State.
Foreign companies registered to do business in the US.
Q: Are any U.S. companies exempt from the need to file?
A: Some entities are exempt from BOI reporting. These include:
Publicaly traded companies
Large companies with more than 20 full-time employees and $5+ million in gross receipts.
Banks, credit unions, insurance companies, and certain other regulated entities (which generally have already provided beneficial ownership information elsewhere).
For a full list of exemptions, visit FinCEN’s exemptions page.
Q: What information must be reported?
A: The reporting company must provide each beneficial owner’s:
Full legal name
Date of birth
Residential or business address
Unique identifying number (e.g. passport number, driver’s license number) and an image of the corresponding document
Q: What’s the point of this? Isn’t that information required when starting a company and filing with the Secretary of State?
A: In many jurisdictions, a company can be owned by another company, which can be owned by another company, etc., thereby hiding the identity of the true beneficial owners. FinCEN wants a way of knowing what individuals have ultimate ownership of a company.
Q: What is the deadline to report beneficial ownership information?
A: Entities created before January 1, 2024 must submit reports by January 1, 2025. Entities created on or after January 1, 2024 must submit reports within 30 days of creation.
Q: How do I file my BOI report?
A: BOI reports must be submitted through FinCEN’s Beneficial Ownership Secure System (BOSS), which provides step-by-step instructions for filing. Step-by-step instructions for reporting are available here: FinCEN BOI Reporting Guide.
Q: Does this include side-hustles, small businesses, and entities I own but haven’t really used in years?
A: Yes, if your business is registered as an entity with the Secretary of State (e.g. LLC, S-Corp, etc.), unless an exemption applies (see above). Sole-proprietors that do business under their own name without a registered entity do not have a reporting obligation.
Q: If I don’t own or manage a business, is there anything I need to do?
A: No, this is only relevant for those that own or manage a business with an obligation to report.
Q: Are there penalties for not reporting BOI information?
A: Failure to file a BOI report, or submitting false information, can result in significant penalties, including:
Civil fines of up to $500 per day of non-compliance.
Criminal penalties of up to $10,000 and/or imprisonment for up to two years.
Q: Wasn’t there a court case that declared this whole BOI reporting thing unconstitutional?
A: Yes. In March 2024, a federal district court ruled that the Corporate Transparency Act (CTA), which mandates BOI reporting, was unconstitutional. However, the U.S. Department of Justice appealed this ruling, and the appeal is currently pending. As it currently stands, the court’s injunction applies only to the named plaintiffs. Therefore, unless your business was a member of the National Small Business Association (NSBA) as of March 1, 2024, the BOI reporting requirements remain in effect for you.
For more information about the BOI reporting requirements, exemptions, and deadlines, visit FinCEN’s official BOI resource page.
This is a Q&A-style primer for the 2024 election. I went with a potentially triggering title intentionally, because that’s what we’re used to on anything election-focused. Rest assured, I’m not warning about anything financially dreadful that is likely to occur as a result of the upcoming election.
Q: What is the “Election Warning” about then?
A: It’s a warning about possible emotional reactions to the results, delays in the results, or financial market volatility around the results of the election. We’re all human. We all panic sometimes. We all make decisions in the midst of a panic. My hope is that by acknowledging this in advance, we can invite logic and calm to the part of the brain that feeds off anxiety. We’re one day out from what the candidates and the media would have you believe is THE MOST IMPORTANT ELECTION OF ALL-TIME. That very well may be the case, especially if things you highly value are at risk of changing or things you’re strongly against are at risk of not changing. I would just note that virtually every presidential election and many mid-term elections are presented as THE MOST IMPORTANT ELECTION OF ALL-TIME. The candidates want you involved to increase the odds that you will donate and ultimately vote. The media wants you interested to increase the odds that you tune in, read, or click (which leads to advertising or subscription revenue). The entire process is designed to put you on edge, especially if you live in a “battleground state” like I do, where we are beaten over the head with divisive, ugly messages for months in advance of the election. There is much at stake that is not financial in nature. I acknowledge that and don’t want to minimize it. But, the anxiety over those non-financial issues can carry over into personal finance, especially if we see markets gyrating due to the same stress-inducing election. A recent poll conducted by the Certified Financial Planning (CFP®) Board, showed that a staggering ~80% of Americans expect their personal finances to deteriorate if their preferred candidate loses the 2024 presidential election. It always feels bad if the other side wins. It’s important to acknowledge that our biases play more of a role in feeling that an election will be financially negative than historical facts do. Here’s another example:
Regardless of your party affiliation, if the President comes from the party that you lean toward, you’re much more likely to have a positive view of economic conditions than if the other party is in power. The effect takes hold very shortly after election day, so it’s not the impact of actual policy changes or legislation driving this result. It’s our biased view of what’s to come.
Q: Isn’t it better for the stock market if one side wins than the other?
A: I haven’t seen any evidence that would lead me to a conclusion one way or the other.
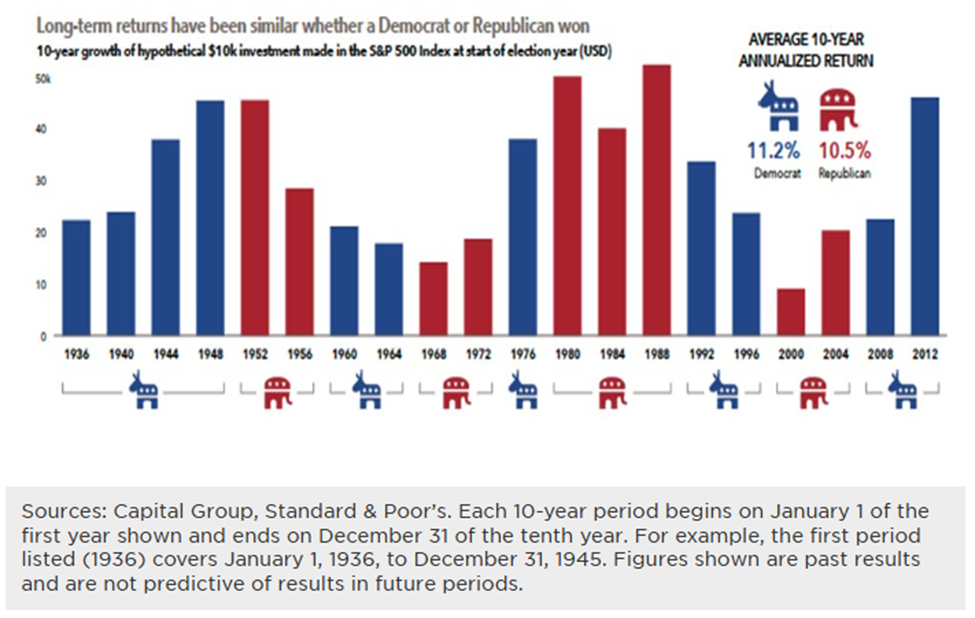
The one thing that is very clear is that stocks tend to go up and the economy tends to grow over the long-term, regardless of who is in the White House.
Note the scale on the left of the chart is not linear. Sure, there are dips here and there, but the takeaway should be clear… over 90 years and through multiple presidents from both parties, a $1000 investment in the S&P 500 grew almost 25,000x to nearly $25M. I went back and checked that because it seemed like maybe a typo. It’s not. It’s the stunning power of compound growth over a long period of time. Instead of worrying about the relatively small dips in the rollercoaster, we just need to zoom out and focus on the extreme upward-sloping ride.
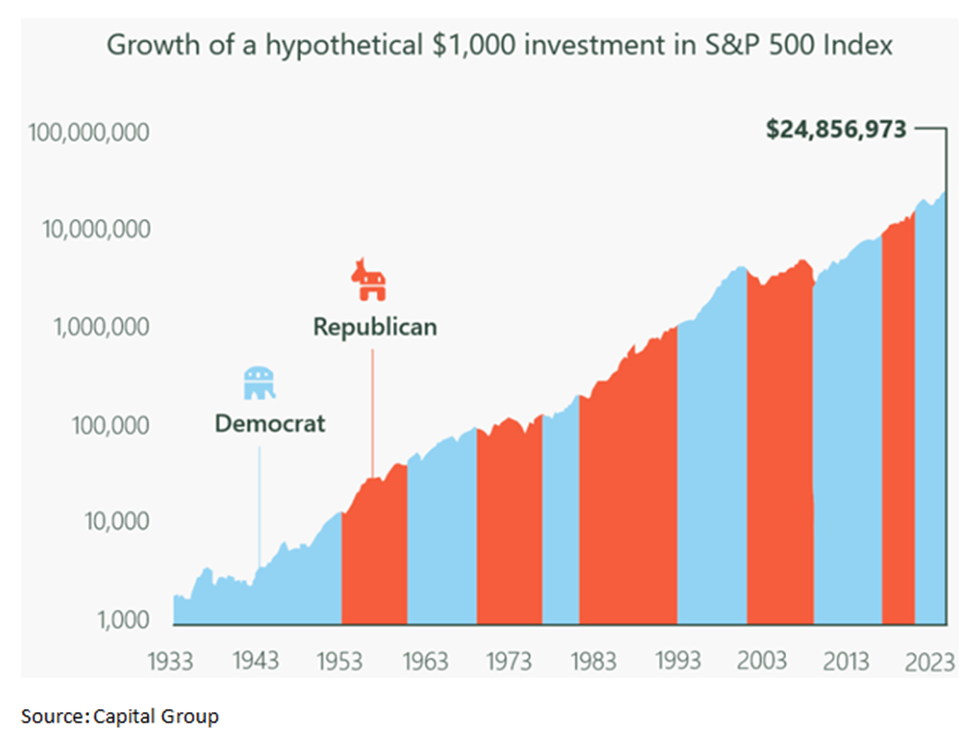
Q: That chart starts just after the Great Depression though. Wouldn’t including that change things?
A: Thanks to Ibbotson Global Financial Data and BofA, we can take this data back to pre-Civil War times and it’s even more impressive. The chart below shows the growth of large US companies for 200 years on a logarithmic scale. That means the values didn’t grow from 0 to 17x over that period. They grew 10^17th times, or 1,000,000,000,000,000,000x! Population growth, productivity growth, and inflation just simply swamp all the minutia over time. You can see the Great Depression on the chart. Notably, you can also see that it mostly just brought growth back in line with the historical trend.
Q: What about the short-term?
A: If you’re invested in stocks for the short-term, you’re just gambling. That doesn’t make sense. Either money is needed for the short-term and shouldn’t be primarily invested in stocks or money isn’t needed for the short-term and the short-term doesn’t matter. It is fair to guess that the stock and bond markets will be volatile as election results come in, especially if election results are delayed. There is an old market adage that states that markets hate uncertainty. Peak uncertainty, from a political perspective, will take place just as polls are closing on election night. Slowly, the uncertainty will be drained from the system and the market will price in victory for one of the candidates, with their likely policy platform, probability adjusted for the odds that it can move through Congress.
Even sector-based predictions are tough to make based on who is president. Richard Berstein recently pointed out that Energy has been the best-performing sector during Biden’s presidency and the Emerging Markets outperformed US Small Caps during Trump’s. Pundits would typically forecast the exact opposite.
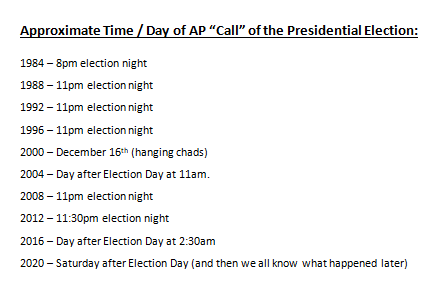
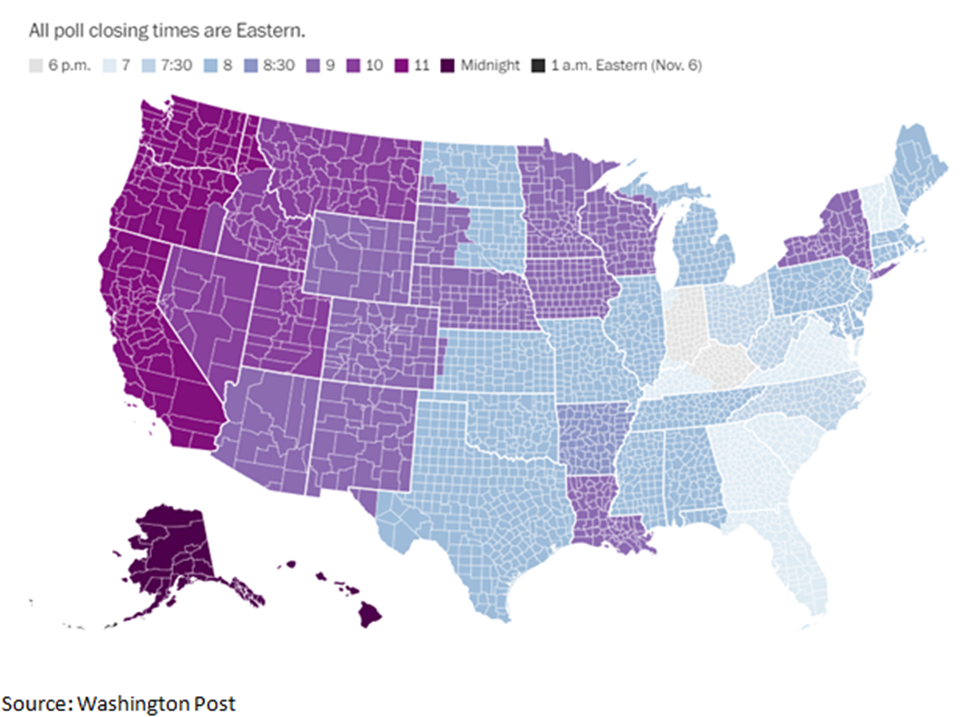
Q: How slowly will that uncertainty be drained? When should we expect election results:
A: We can look back at previous presidential elections for clues:
We can also look at how states count ballots, when polls close, and what the news outlets expect in the battleground states:
My notes on ballot counting, by state:
Arizona – multiple referendums, long ballot, lots of manual counting likely needed. Delay could be several days.
Georgia – fairly quick count, but possibly misleading start. Mail-in ballot counting starts at 7am on election day, so the first report will be mostly those ballots, which have historically skewed Democratic. That means a Harris early lead, with Trump closing the gap as more ballots are counted is likely.
Michigan – counted about 45% of the vote by midnight in 2020. Likely to be a close race, so almost definitely won’t be decided election night. Most of the vote should be counted by Wednesday (~95% per NBC News)
Nevada – mails ballots to all active voters. Allows mail-in ballots to be received and counted up to Nov 9. In a close race, results will be delayed at least a few days.
North Carolina – usually a quick count, but storm damage may slow that a bit this year. In 2020, 99% of votes were counted by midnight. Like GA, starts count of mail ballots early in the day, so early results may show a skewed count. Nash County should be the first of ten counties in battleground states that flipped from Trump in 2016 to Biden in 2020 to complete their count around 10pm on election night. Some will view this an early indicator of the 2024 trend. New Hanover is another flip county, expected to complete its count around 10:30pm.
Pennsylvania – can’t start counting mail-in ballots until the polls close. Almost 25% of the votes were mail-in in 2022. However, a lot of investment through the state in making the process better than in 2020 (new machines, more workers, etc.). NBC News expects 98-99% of the vote counted by Wednesday morning.
Wisconsin – fast in the small counties, slower in the large ones which means a possible skewed early lead for Trump given the big city votes should skew Democratic. ~70% of the 2020 vote was in by midnight. Most should be counted by Wednesday (~99% expected per NBC News).
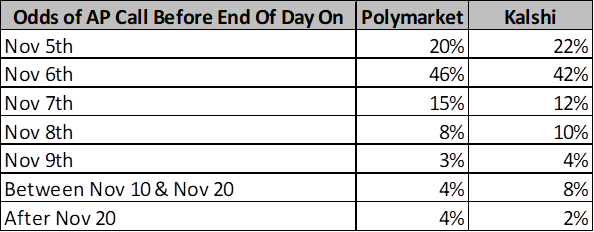
Finally, we can look at prediction markets where real people have real money on the expected result. Here are the odds of when the race will be called:
While I suppose anything can happen, especially after having lived through 2020, Mid-December seems to be the latest possible date of certainty. Under electoral reforms passed after the 2020 election, individual states need to resolve disputes about their results by Dec. 11. If they can’t, the Supreme Court will settle them instead. The Electoral College is scheduled to vote on Dec. 17, which will formalize the result. My opinion: if it’s a blowout, election night is possible, but that seems unlikely given how close the race is (see below). If not, Wed, 11/6 seems most likely. There is potential for it to take several more days, if the race is close and battleground states need recounts or exact counts of all absentee ballots. I think we’ll be pretty certain who won by the end of day on Wednesday, even if the AP hasn’t officially called the race.
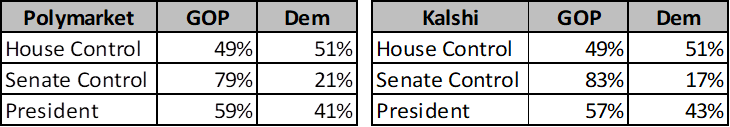
Q: You mentioned the market probability adjusts the odds that the winner’s platform can move through Congress. What are the chances the President will be able to do anything at all?
A: The odds are obviously highest if one party controls the presidency and both chambers of Congress. In an atmosphere as divisive as we currently have, it’s unlikely that much will change from current law, at least not without a lot of compromise, if there is a power split. Currently, prediction markets give the following odds:
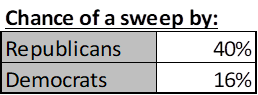
Results are likely to be correlated though. For example, if Democrats outperformed expectations and won the Senate despite only a 21% chance of doing so, it’s almost certain that they also won the presidency and the House. So, the overall chance of full control by each party is somewhat unintuitive from the results above. Since Kalshi has this market available, we can see what’s expected:
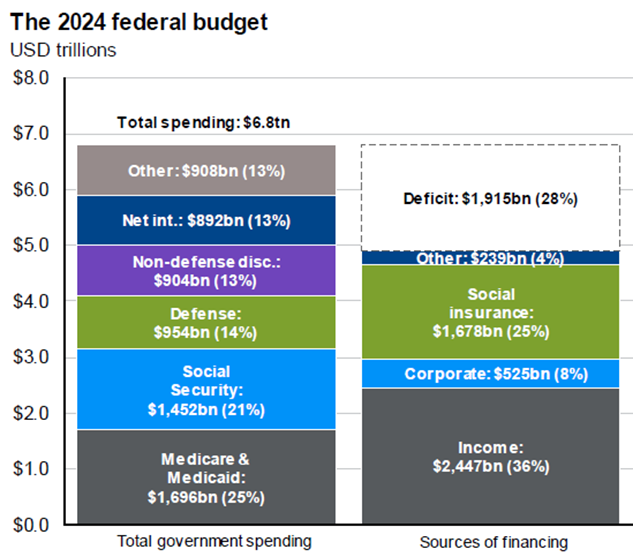
Q: What are the differences between the two candidates’ policy positions that might impact the economy, financial markets, and taxes?
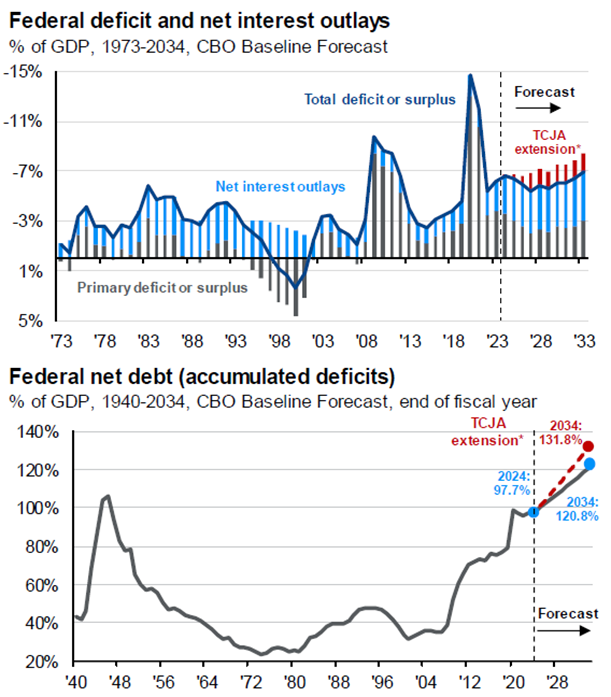
A: A lot of this comes down to the expiration of most of the provisions of the Tax Cuts & Jobs Act (“TCJA”) at the end of 2025. That will happen as the default, i.e. if no new legislation is passed. Notably, the one major provision of TCJA that will not expire in 2025 is the corporate tax rate, currently set to 21%. It would take new legislation to change that.
If Republicans sweep, we may see an extension of the full TCJA, perhaps with even lower individual tax rates, and some provisions made permanent. We would likely see more tariffs on foreign goods as a partial Federal revenue raiser, but overall, we’d likely run higher deficits. If deportations of those who entered the country illegally take place on a mass scale, we may see a labor shortage. Combined with tariffs, this could lead to another bout of inflation. Trump has also suggested no income tax on tips, a deduction for auto loan payments, tax-free overtime and Social Security, ending income tax on citizens living abroad, and a host of other nearly impossible-to-pass and administer provisions, even with full control. The corporate tax rate would almost definitely not increase and could decrease further.
If Democrats sweep, we’d almost definitely see many provisions of the TCJA expire. That means higher tax rates, at least on middle-to-upper-income families ($400k/yr in income seems to be the dividing line). It probably means higher taxes on capital gains, higher investment income taxes (Medicare Surtax), and possibly a change that would make death a capital gains realization event, with some exemption. The corporate tax rate would likely increase as well. The higher taxes would help somewhat with deficits, but there would also be an expansion of the Child Tax Credit and possibly more incentives to move toward alternate energy. Overall, the package is likely to be closer to revenue-neutral, meaning the existing deficit might not grow, but it would still exist and drive additional debt.
If power is split, the corporate tax rate would probably stay where it is since a new law to change it would be difficult to pass. Compromise would be needed to prevent TCJA expiration and so we’d wind up with some mix of higher tax rates, and an expanded child tax credit, but probably no changes to capital gains or investment income tax.
As you can see from the above, there are pluses and minuses in all cases. The only consistent theme is that we’re likely to continue to borrow a lot of money to fund the Federal government.
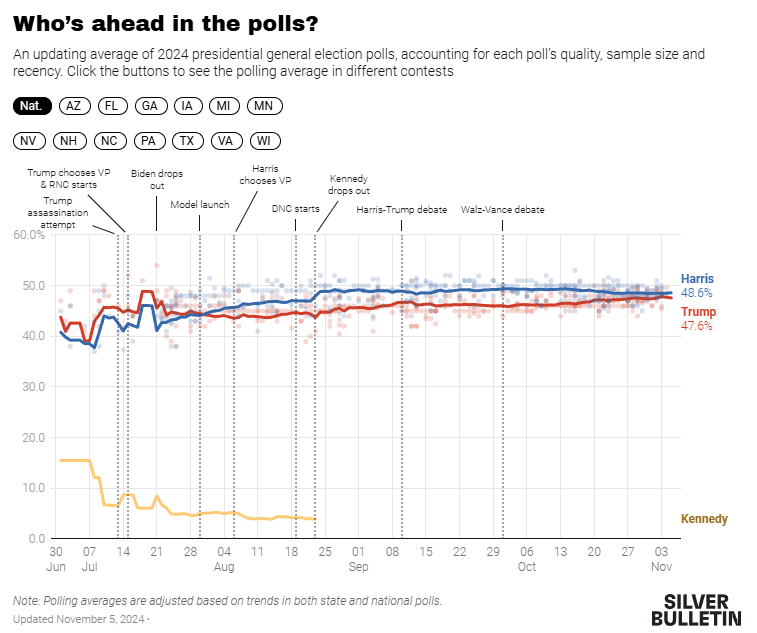
Q: Who is going to win?
A: I’ve never been more confident in my conclusion in any previous election. That conclusion: “I don’t know.” On the polling side, things are really close and there are a lot of reasons one could infer that polls are undercounting voters on both sides.
Nate Silver’s “Silver Bulletin” does a rigorous aggregation of the various polls, weighting by previous accuracy, by likely vs. registered voters, and by reported margin of error. He then runs a model that simulates different results based on the polling aggregates as well as economic and demographic data and uses the simulation to determine the probability of each possible result. His conclusion, as of 12:30am on Election Day Morning, after pouring through an insane amount of statistical data, was that Harris had a 50.015% chance of winning the election to Trump’s 49.985%. We can’t get much closer than that.
Prediction markets have Trump further ahead, but with some wild gyrations over the past several days. His lead on Polymarket has been as high as 67-33, but currently sits at 59.7-40.3. Kalshi favors Harris slightly more, with Trump ahead 57-43. PredictIt, an older prediction market that imposes fairly small position limits, has a 50-50 tie.
I’ve been following an aggregator called The Super Model, which attempts to put this all together and come up with a weighted total forecast. They have Trump up 56-44.
My take: this is just too close to call. That doesn’t necessarily mean the election will be won by a small margin. It just means that the predictive data we have available doesn’t reveal a conclusion with any level of confidence. The probability margins we’re talking about are equivalent to a 1.5 point spread in a football game. It doesn’t mean the score is necessarily going to be that close, but that’s how close fair odds would be going in.
In summary, we’ll know a lot more in a couple of days about the politics of the next four years. Regardless of the stock market’s short-term reaction, none of it is likely to outweigh the long-term economic growth potential of the US economy. If you feel any election-induced anxiety about financial markets or your financial plan, try to zoom out to the big picture and the long-term. There isn’t a result I can forecast that would lead to me issuing an “Election Warning” for your finances. The 2024 Election will come and go like all the previous ones. And then we’ll start hearing about the MOST IMPORTANT ELECTIONS OF ALL TIME to come in 2026 and 2028.
The IRS has released the key tax numbers that are updated annually for inflation, including tax brackets, phaseouts, standard deduction, and contribution limits. Due to rounding limitations, not all numbers have changed from last year, but tax bracket thresholds have increased by just under 2.8%. The notices containing this information are available on the IRS website here and here. Some notable callouts for those who don’t want to read all the way through the update:
Max contributions to 401k, 403b, and 457 retirement accounts will increase by $500 to $23,500. The catch-up max remains at $7,500, if you’re at least age 50. New this year, if you’re age 60-63, your max catch-up contribution is increased by 50% to $11,250. That means the maximums by age are:
Under 50: $23,500
50-59: $31,000
60-63: $38,750
Over 63: $31,000
Max contribution to a SIMPLE retirement account will increase by $500 to $16,500 (+$3,500 catch-up if you’re at least age 50 +$1750 additional catch-up if you’re 60-63).
Max total contribution to most employer retirement plans (employee + employer contributions) increases from $69,000 to $70,000 (plus catch-ups noted above).
Max contribution to an IRA remains at $7,000 (+$1,000 catch-up if you’re at least age 50).
The phase out for being able to make a Roth IRA contribution is $246k (married) and $165k (single). Phase out begins at $236k (married) and $151k (single).
The standard deduction increases by $800 to $30,000 (married) and by $400 to $15,000 (single) +$2000 if you’re at least age 65 and single or $1600 each if you’re married and at least 65.
The personal exemption remains $0 (the Tax Cuts & Jobs Act eliminated the personal exemption in favor of a higher standard deduction and child tax credits).
The child tax credit remains at pre-2021 rules at $2,000 per child, phasing out between $400-440k (married) and $200-220k (single).
The maximum contribution to a Health Savings Account (HSA) will increase to $8,550 (married) and $4,300 (single).
The annual gift tax exemption increases by $1,000 to $19,000 per giver per receiver.
The lifetime gift / estate tax exemption increases to $13,990,000 (c’mon IRS, you couldn’t round up and make it easy?!? Note that this will be reduced by 50% starting on 2026 if the TCJA expires as it is set to. Another post on TCJA expiration is coming soon!
Social Security benefits will rise 2.5% in 2025. The wage base for Social Security taxes will rise to $176,100 in 2025 from $168,600.
Updated mileage rates for 2025 are due out later this year.
You can find all of the key tax numbers, updated upon release, on the PWA website, under Resources.
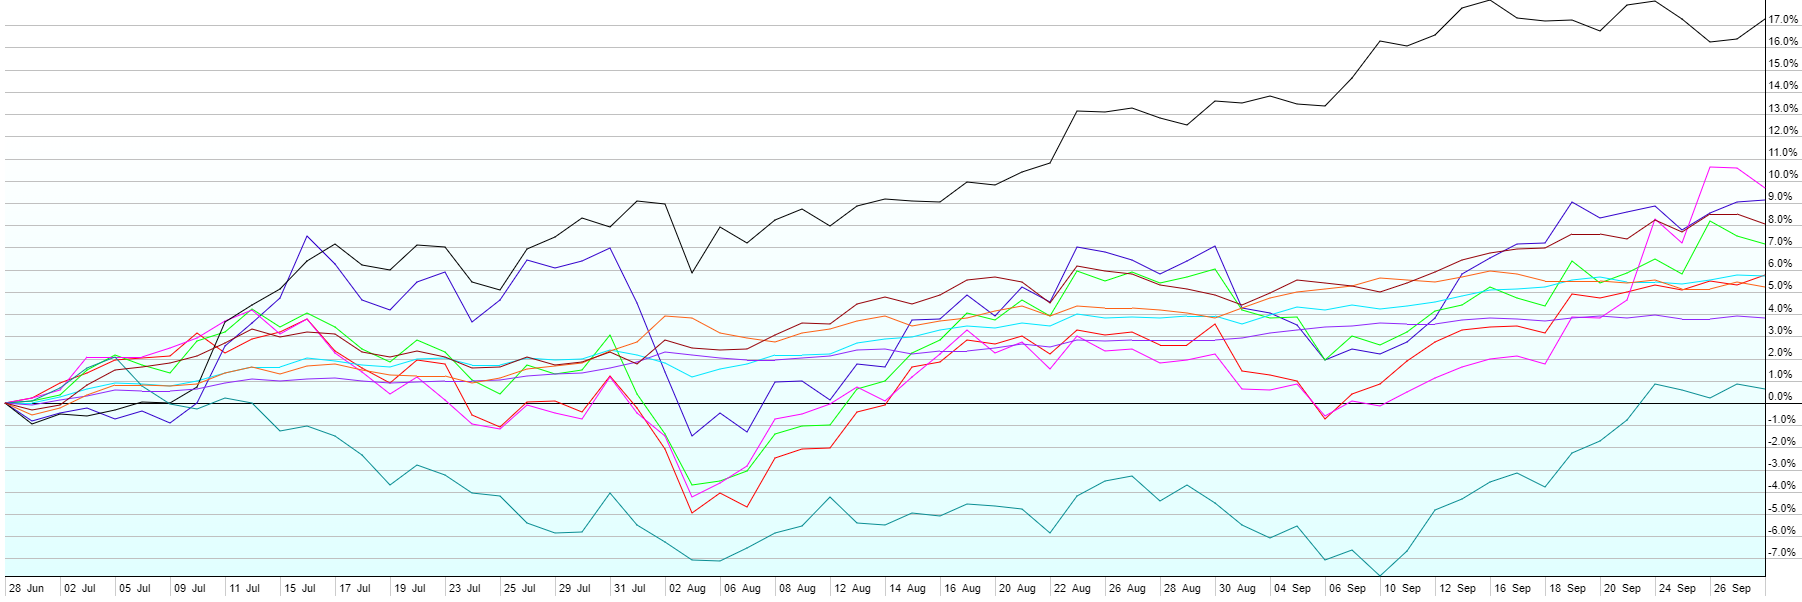
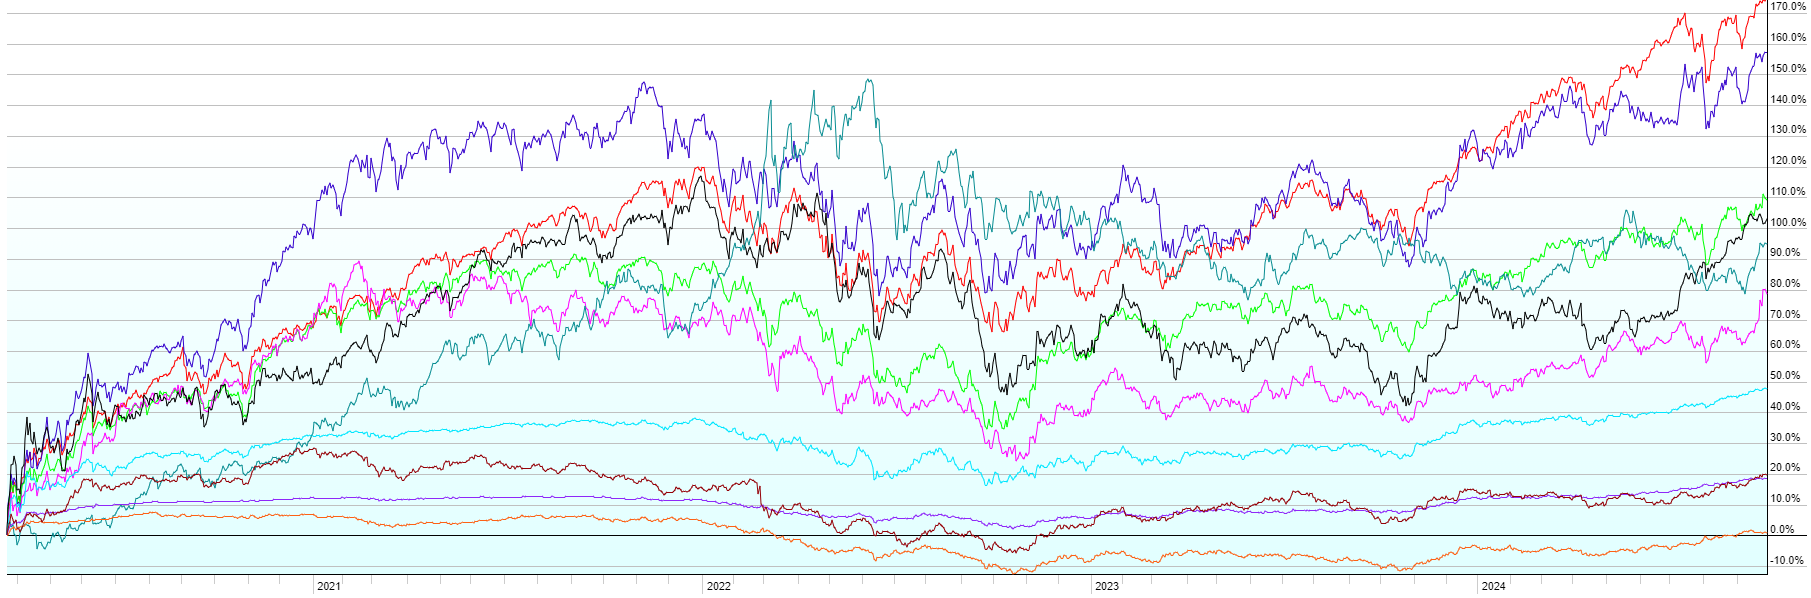
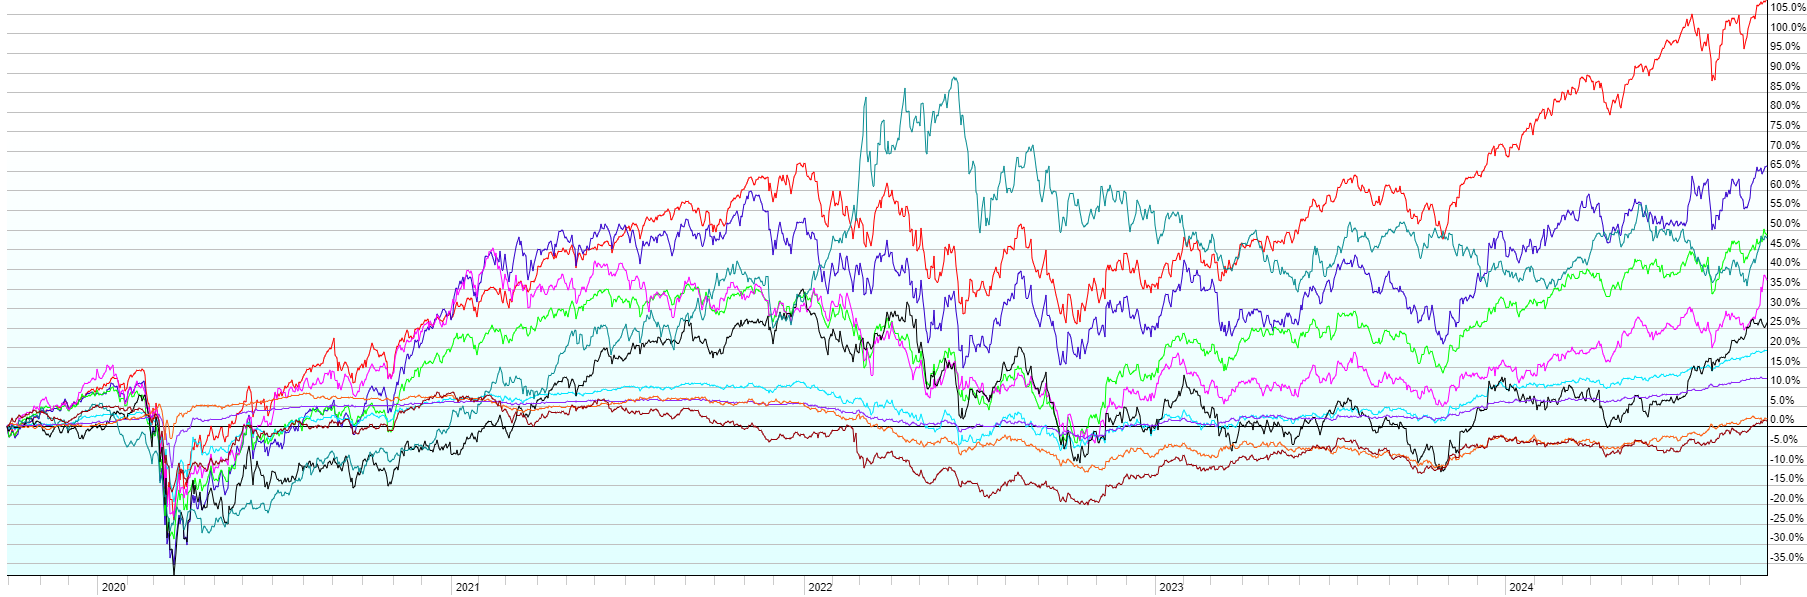
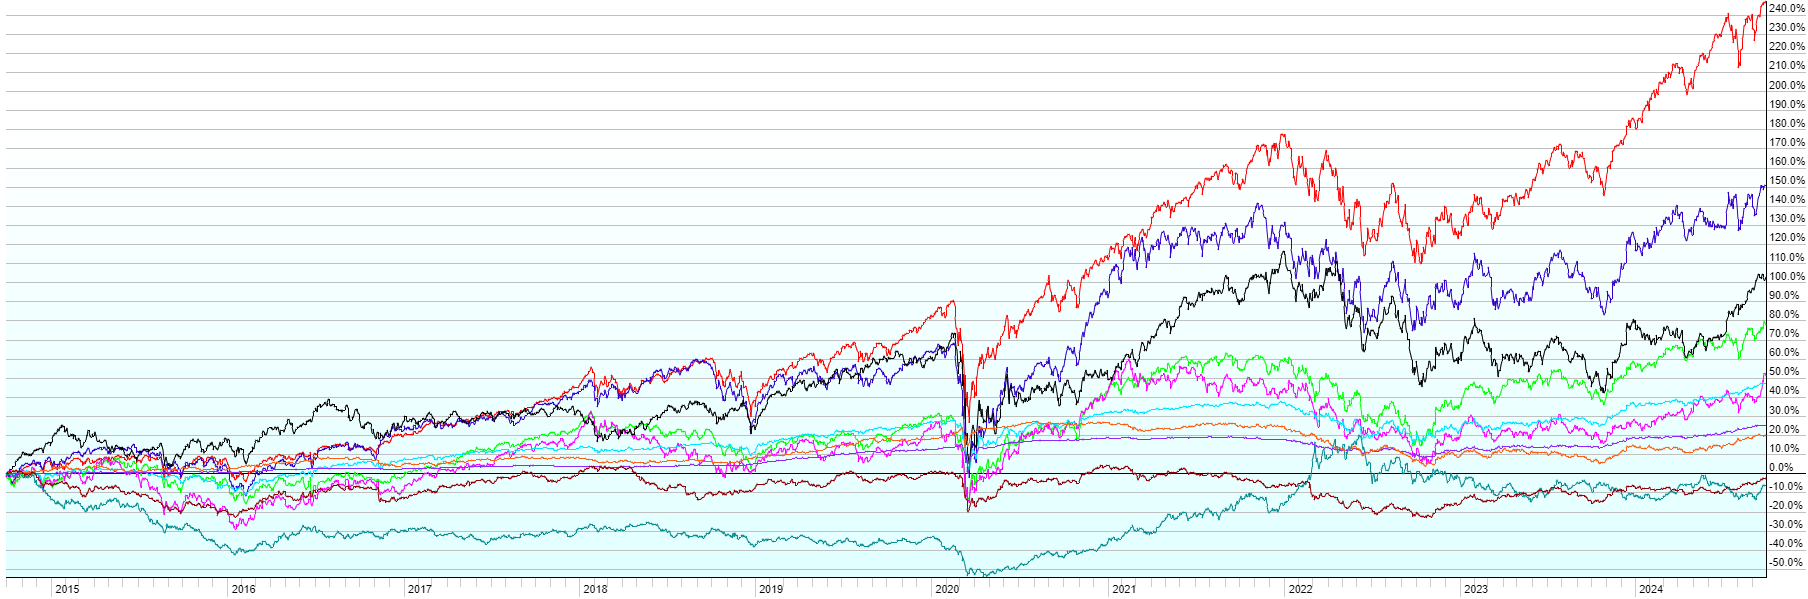
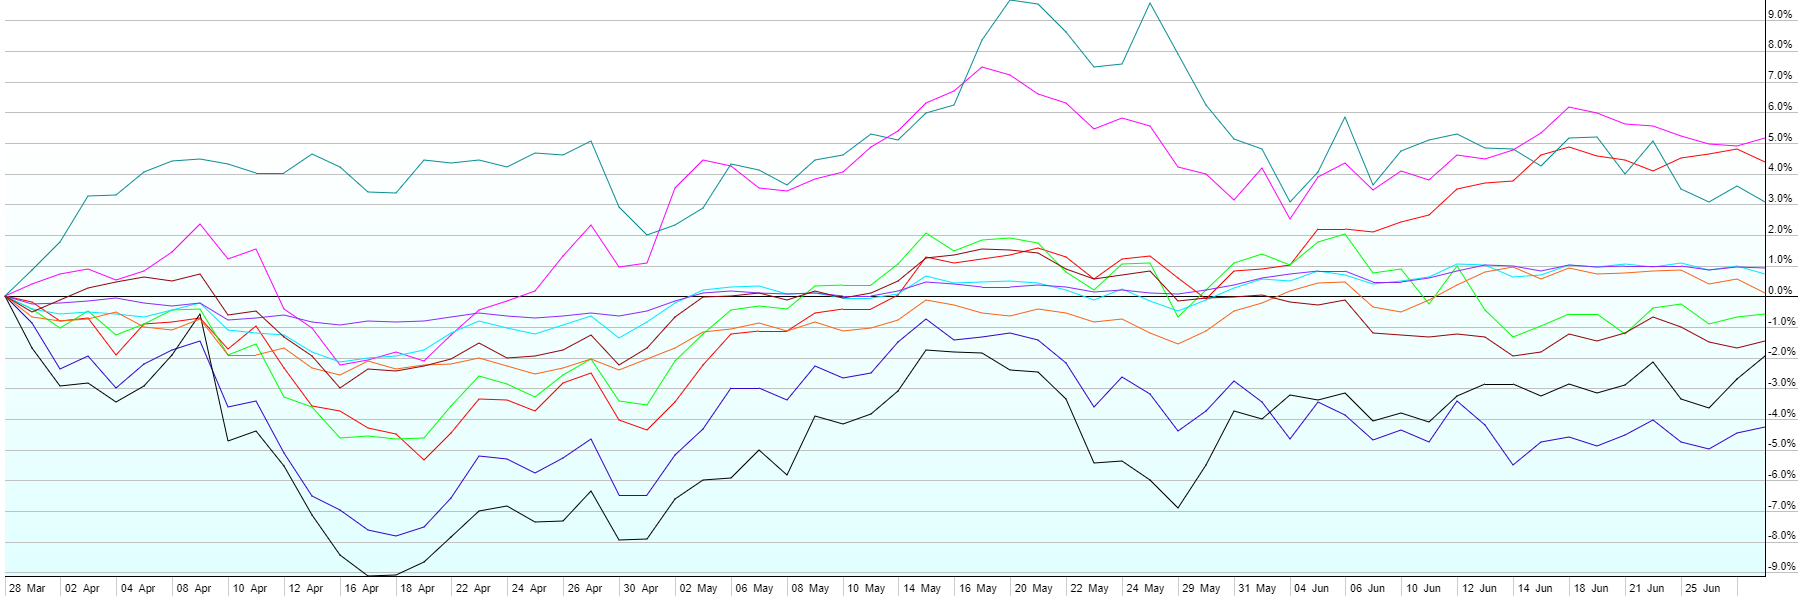
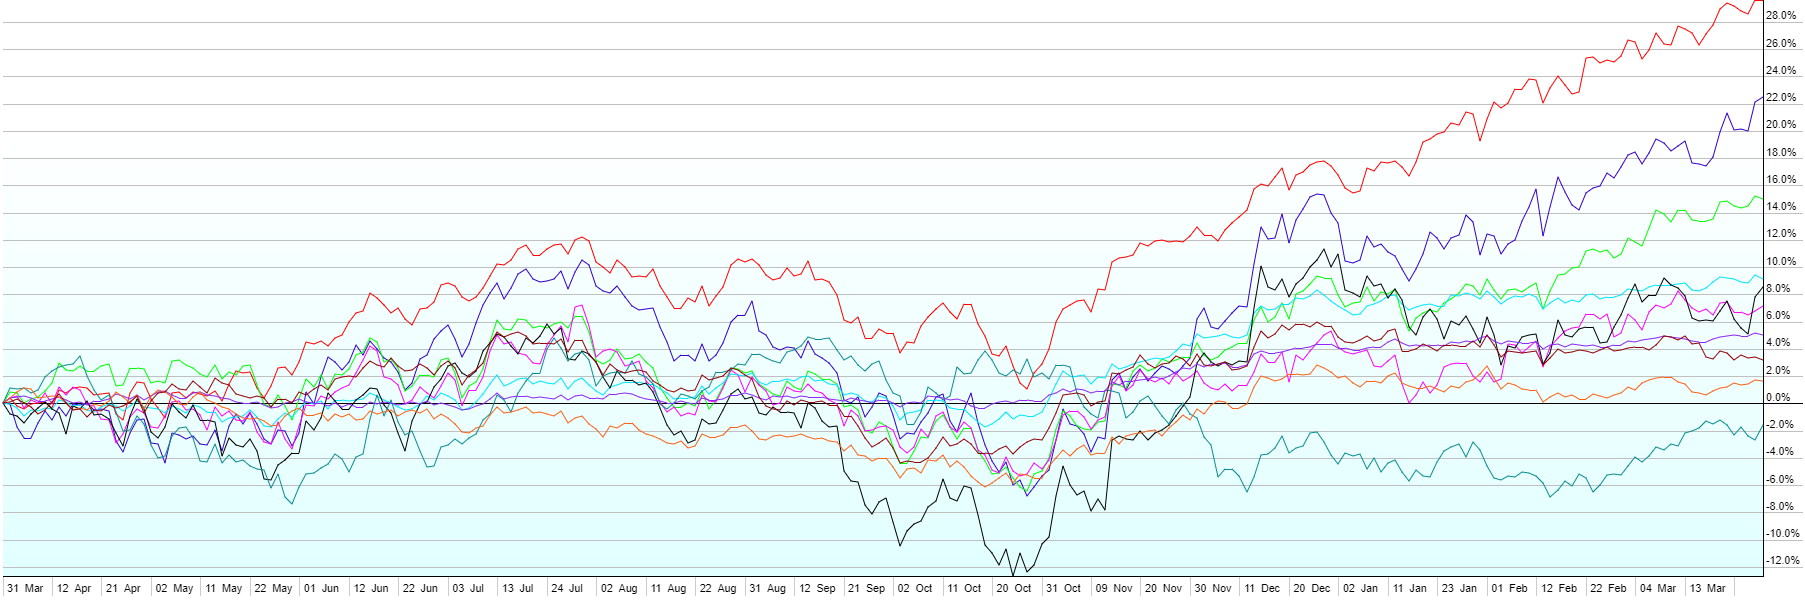
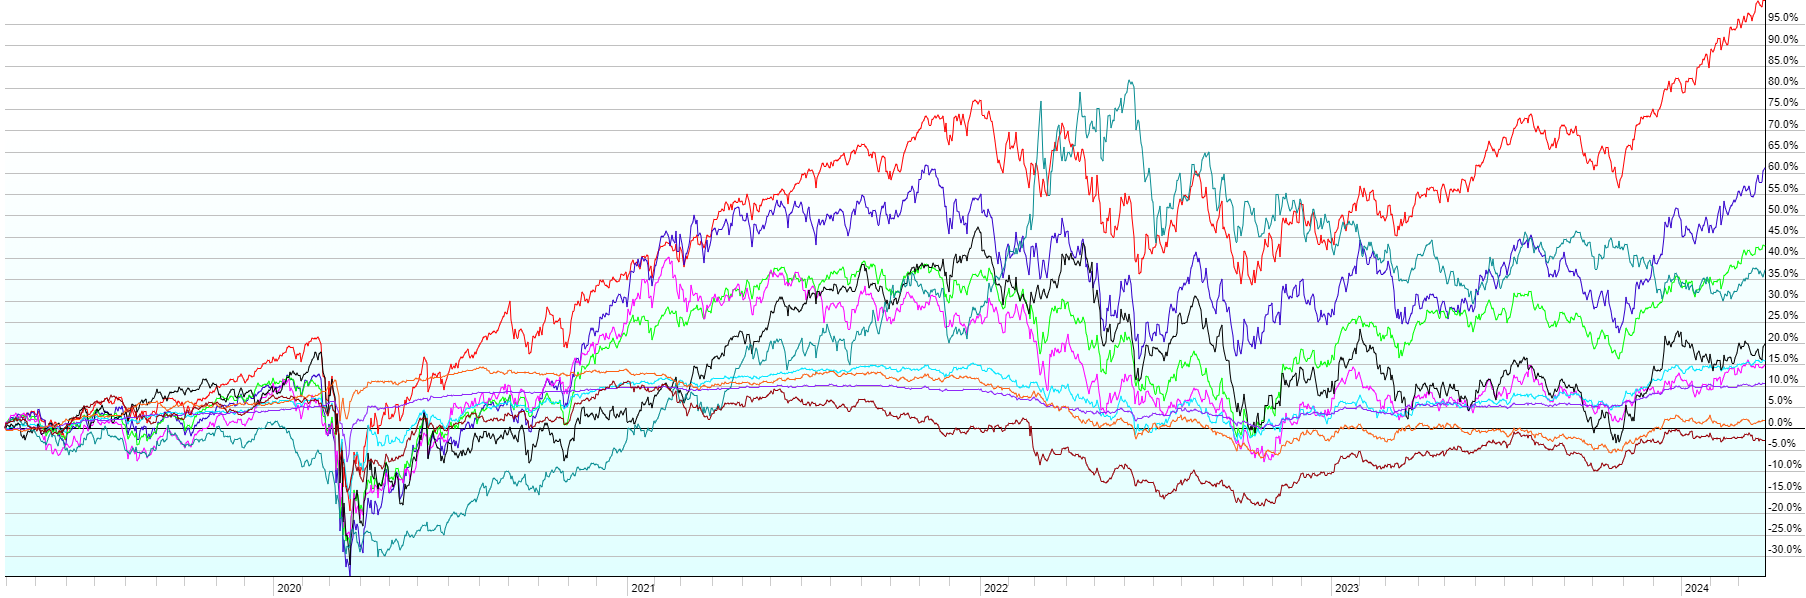
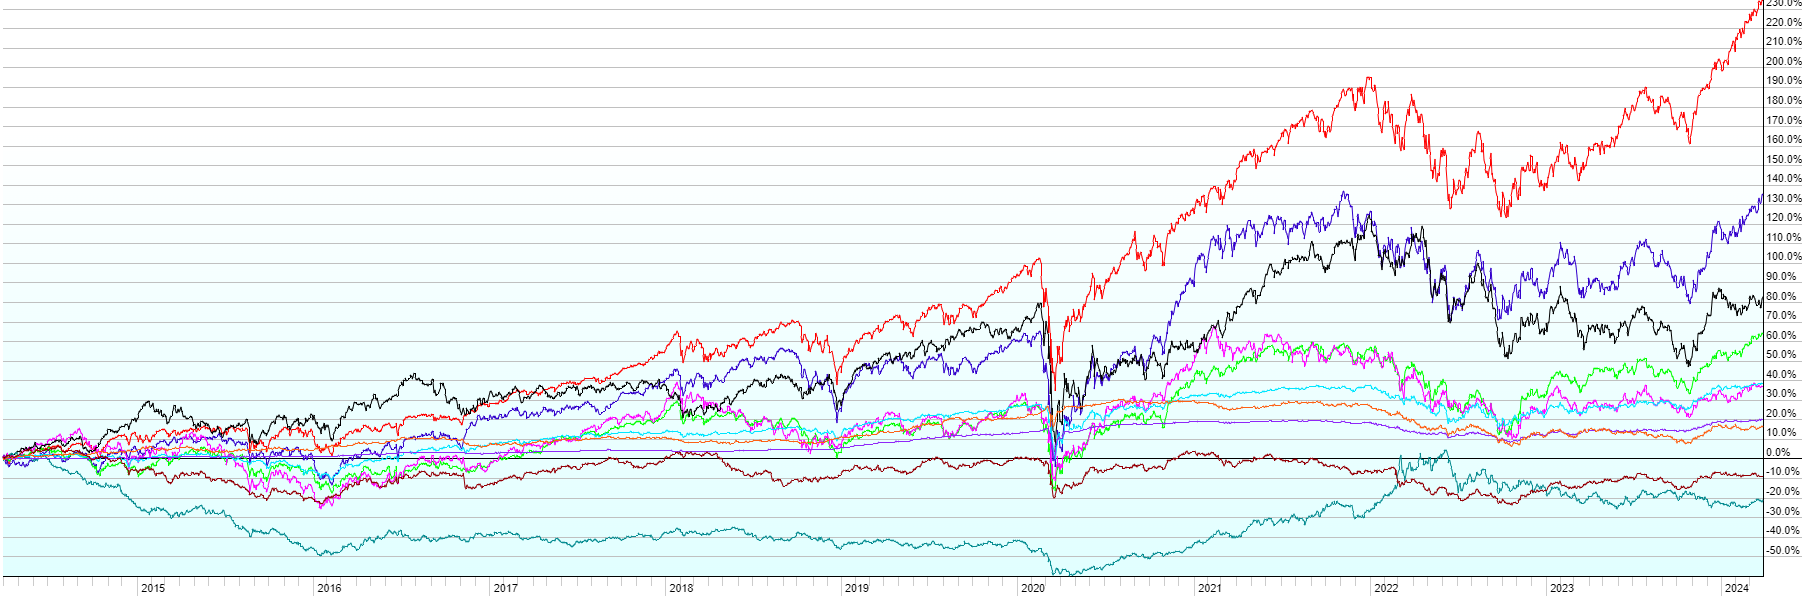
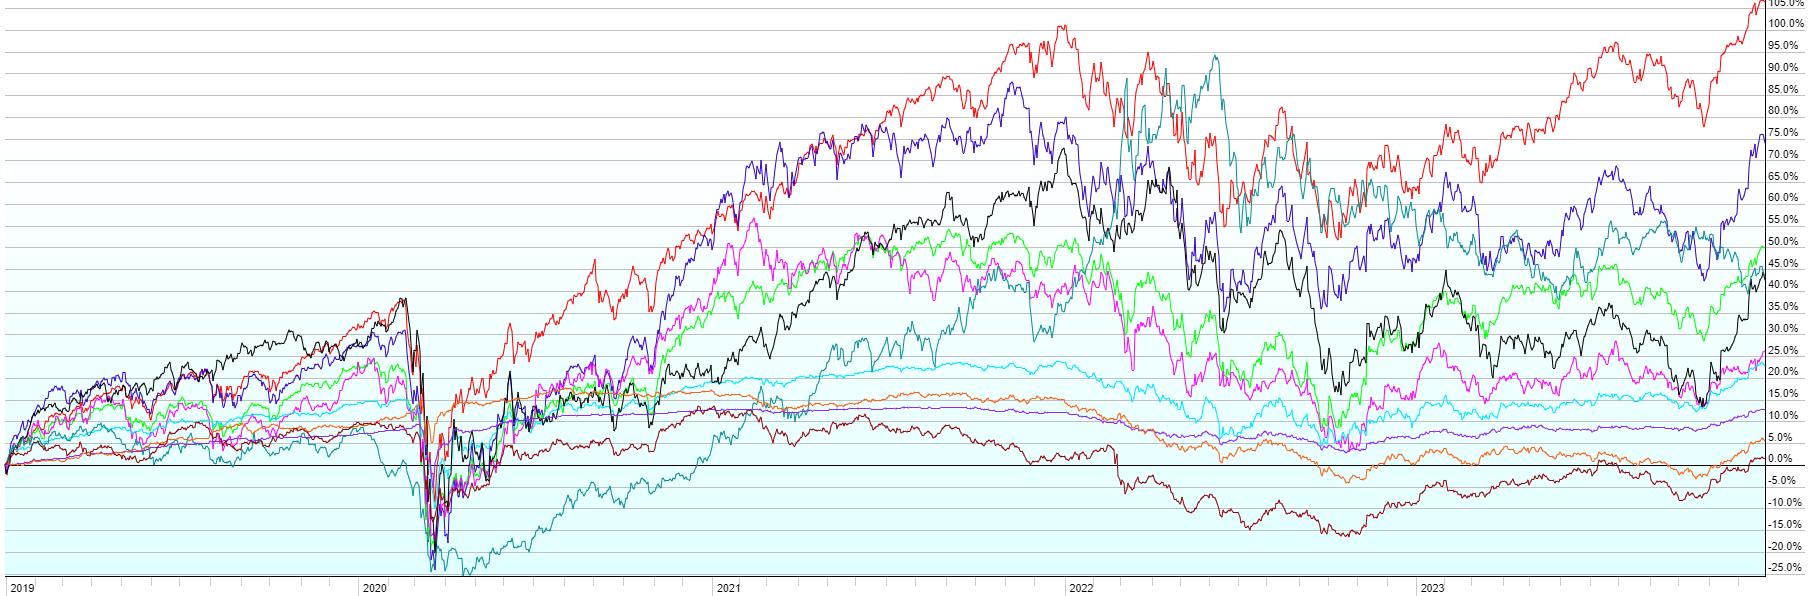
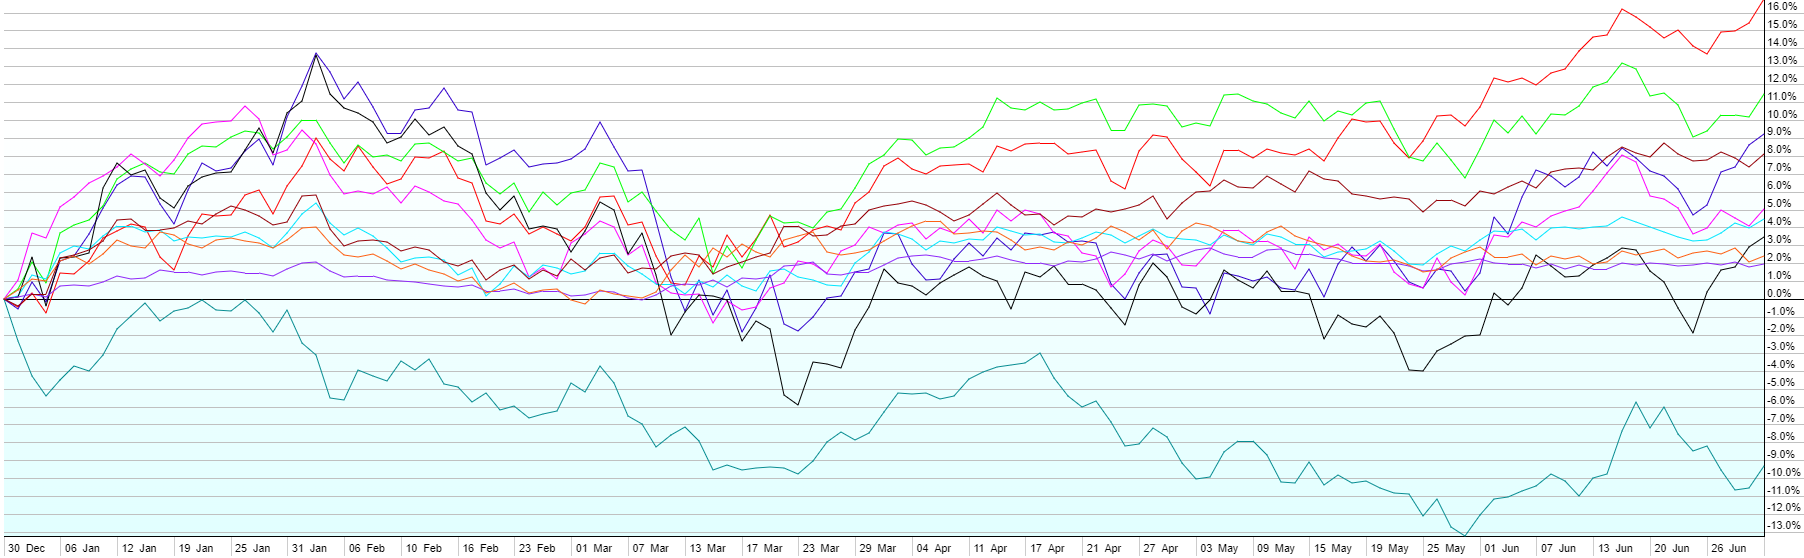
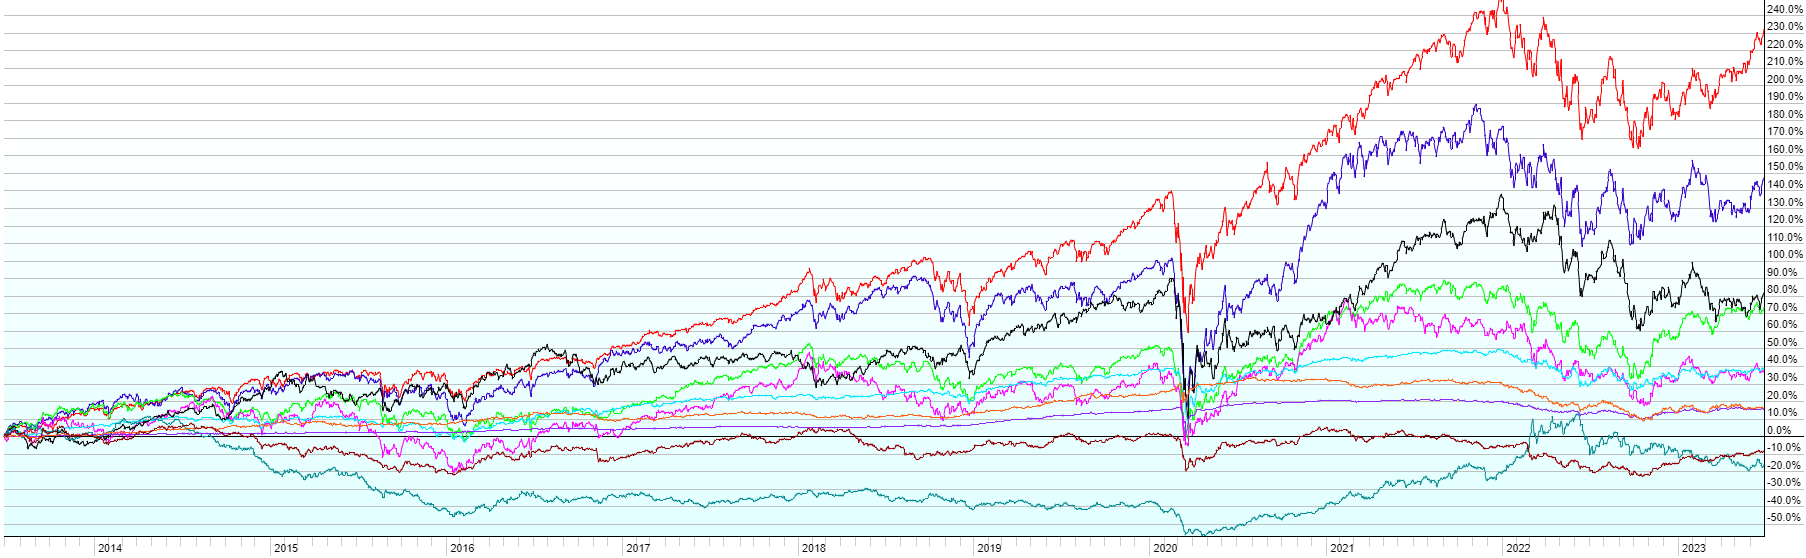
This post contains the usual returns by asset class for this past quarter (by representative ETF), year-to-date, last 12 months, last five years, last ten years, and since the covid low (3/23/2020). While there is still no predictive power in this data, I’ll continue to post this quarterly for those of you that are interested.
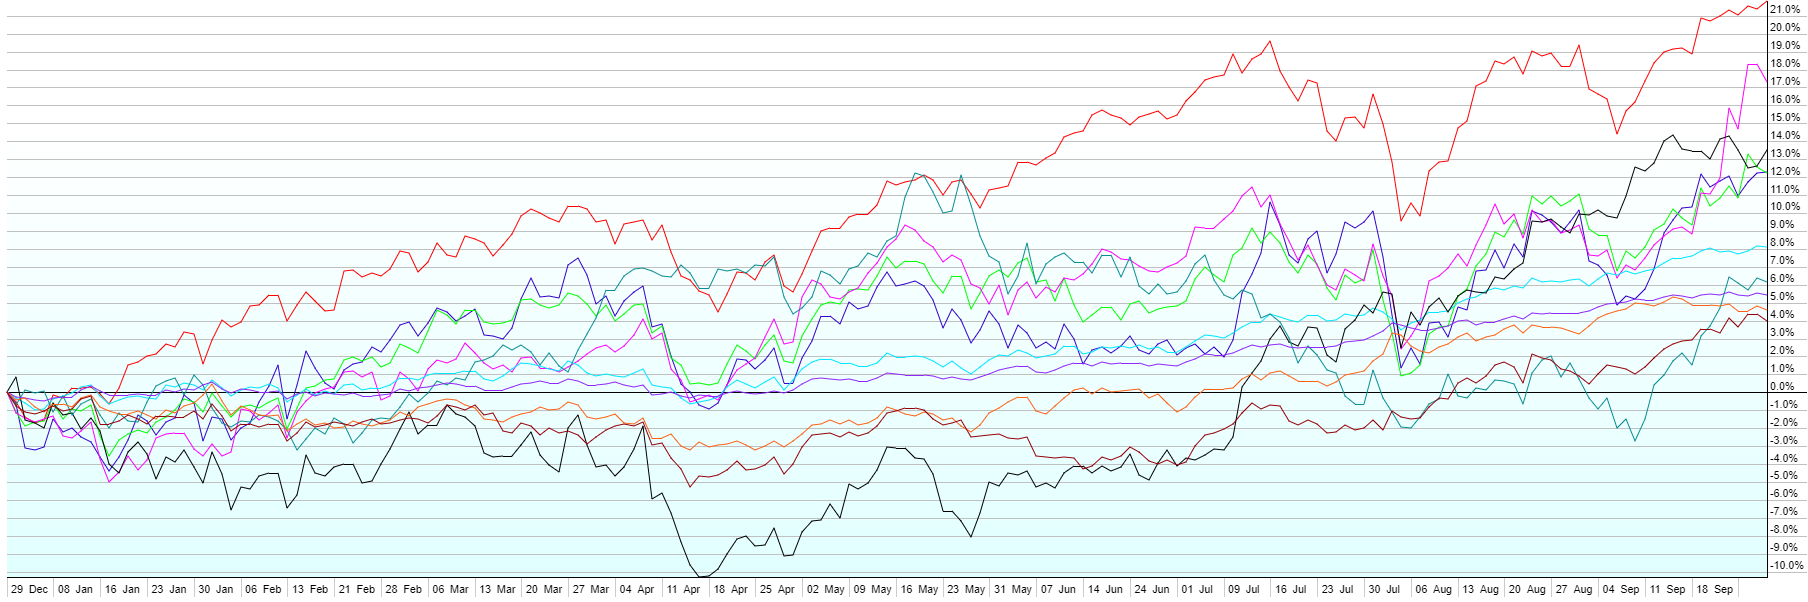
Last Quarter (7/1/24-9/30/24)Year-To-Date (1/1/24-9/30/24)Last 12 Months (10/1/23-9/30/24)Since Covid Low (3/23/20-9/30/24)Last 5 Years (10/1/19-9/30/24)Last 10 Years (10/1/14-9/30/24)
A few notes:
Q3 2024 was a fantastic quarter for financial markets as the US economy chugged along, inflation continued to ease around the world, China launched new stimulus measures to strengthen it’s economy, and the Federal Reserved began a rate cutting cycle with a 50 basis point reduction in the Fed Funds rate. Rather than waiting for severe economic weakness to cut rates, as they have typically done in the past, the Fed decided to cut aggressively and begin to ease up on the brakes they’ve been applying to the economy as a way of fighting inflation. All asset classes that we follow in this quarterly message posted gains, led by Real Estate Investment Trusts (+17%). In the middle of the pack, but still with strong returns, were Emerging Market Stocks (+9.7%), US Small Caps (+9.1%), Emerging Market Bonds (+8.1%), Foreign Developed Stocks (+7.1%), US Large Cap Stocks (+5.8%), US High-Yield Bonds (+5.7%), US Aggregate Bonds (+5.2%), and Short-Term Corporate Bonds (+3.8%). Bringing up the rear were Commodities, still positive at 0.6% despite a pull-back in the energy sector.
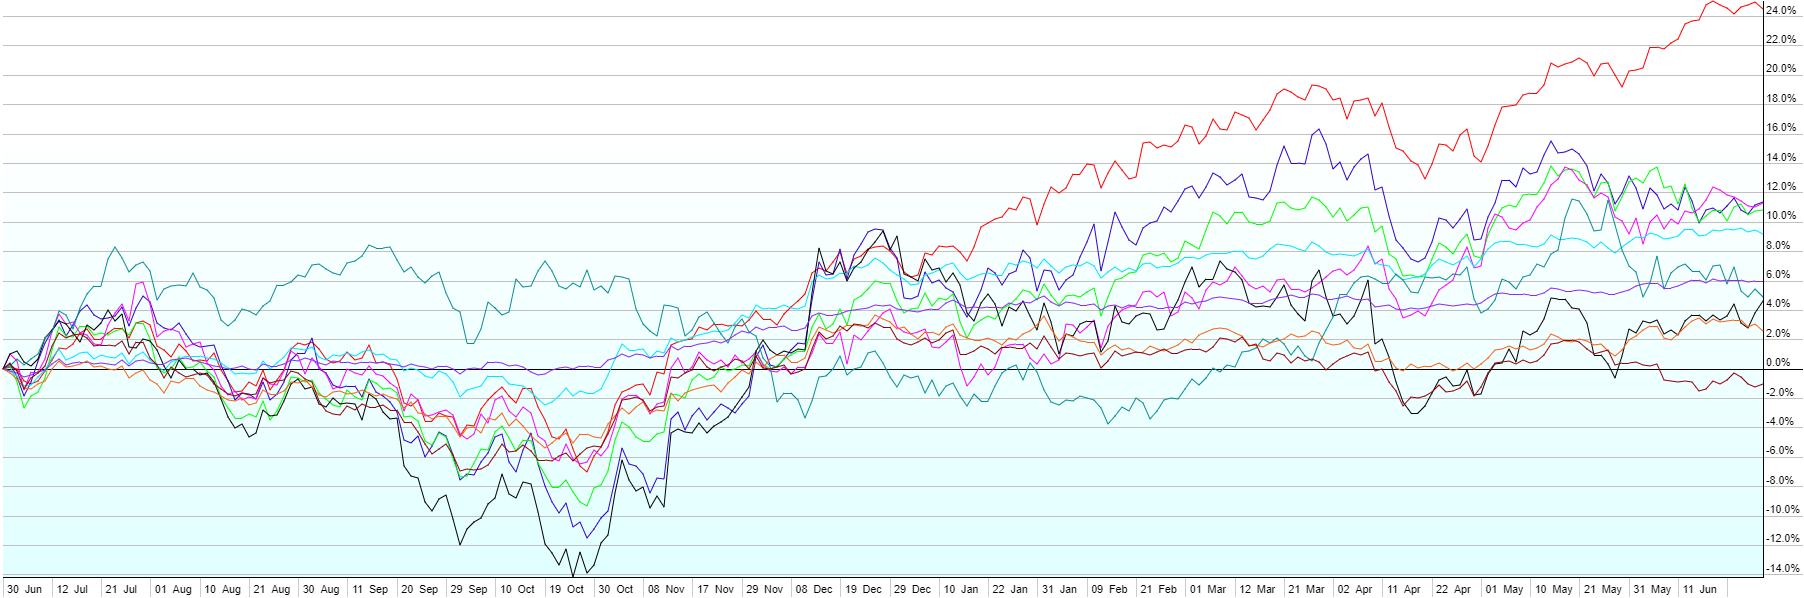
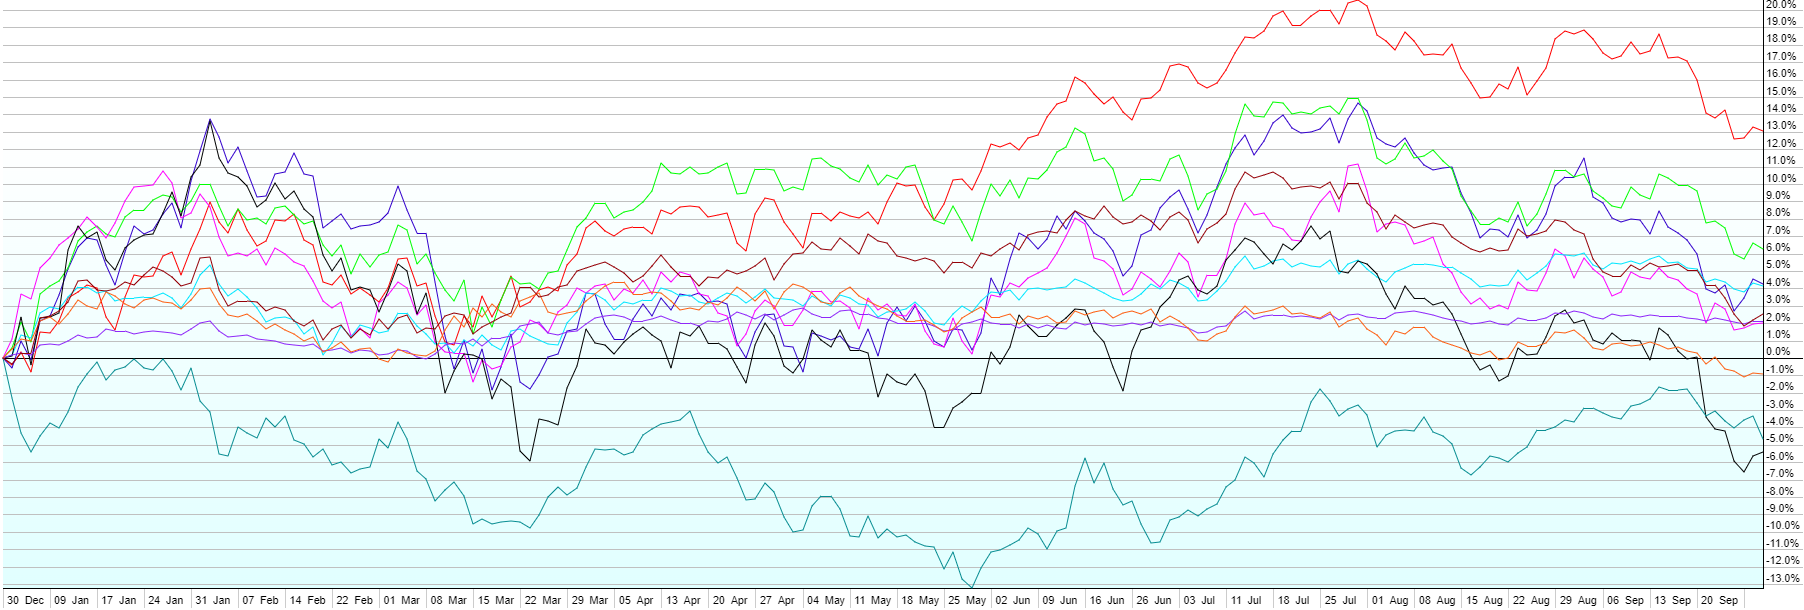
This post contains the usual returns by asset class for this past quarter (by representative ETF), year-to-date, last 12 months, last five years, last ten years, and since the covid low (3/23/2020). While there is still no predictive power in this data, I’ll continue to post this quarterly for those of you that are interested.
Last quarter (4/1/24-6/28/24)Year-To-Date (1/1/24-6/28/24)Last 12 Months (7/1/23-6/28/24)Since Covid Low (3/23/20-6/28/24)Last 5 Years (7/1/19-6/28/24)Last 10 Years (7/1/14-6/28/24)
A few notes:
Mixed results across asset classes for Q2 kept most diversified portfolios relatively steady in Q2 2024. Emerging market stocks and US Large Cap (led especially by mega caps in tech/AI) outperformed with 5.2% and 4.4% returns respectively. On the flip side, US Small Caps were down 4.2% for the quarter with only ~38% of the stocks in the Russell 2000 closing higher than they started the quarter. In between the best and the worst were Commodities (+3.1%), US Short-term Corporate Bonds (+0.9%), US High Yield (+0.7%), US Aggregate Bonds (+0.1%), Foreign Developed Stocks (-0.6%), Emerging Market Bonds (-1.6%), and US Real Estate Investment Trusts (-1.9%).
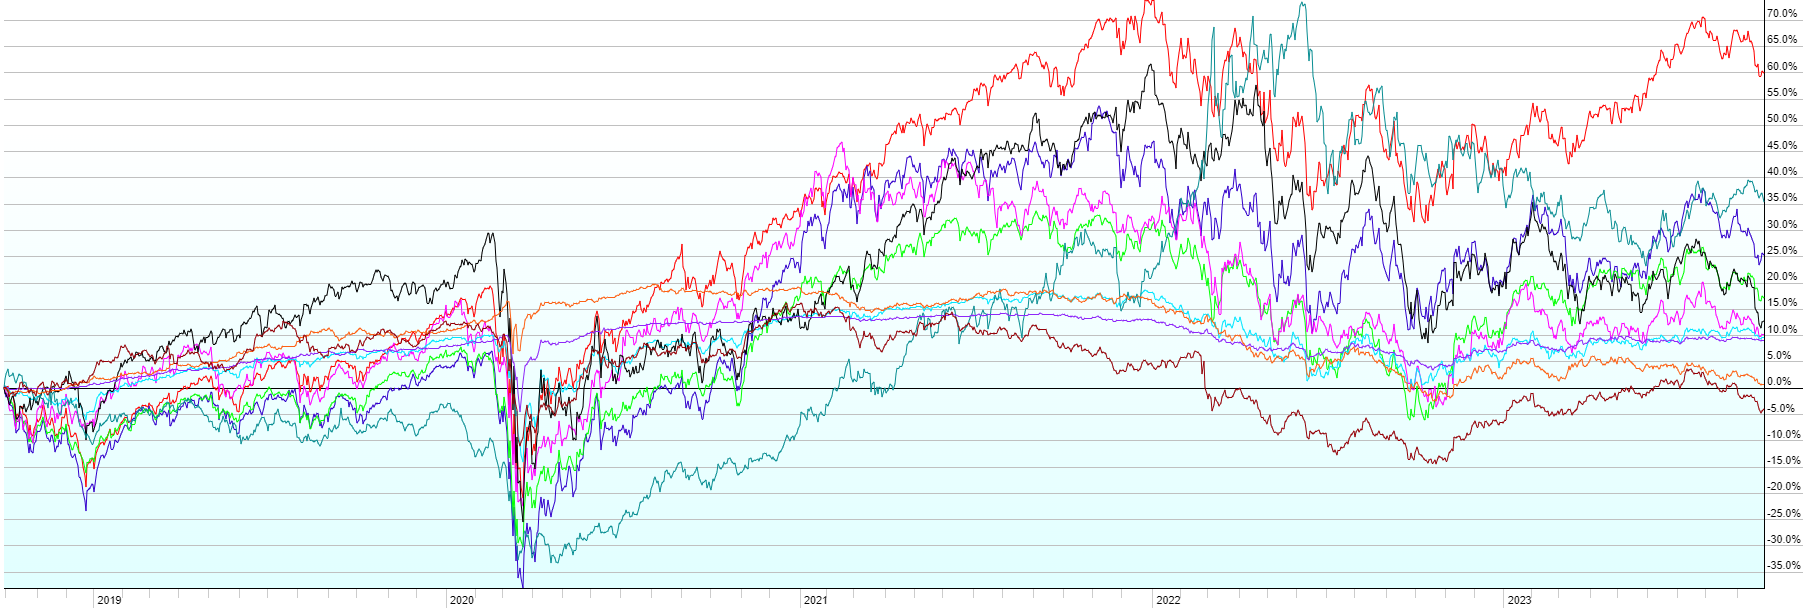
This post contains the usual returns by asset class for this past quarter (by representative ETF), last 12 months, last five years, last ten years, and since the covid low (3/23/2020). While there is still no predictive power in this data, I’ll continue to post this quarterly for those of you that are interested.
Last quarter (1/1/24-3/28/24)Last 12 months (4/1/23-3/28/24)Since COVID Low (3/23/20-3/28/24)Last 5 years (4/1/19-3/28/24)Last 10 Years (4/1/14-3/28/24)
A few notes:
A steadying of inflation at a level higher than the Fed’s 2% target pushed back market expectations for interest rate cuts in the first half of 2024. This led to higher rates across the yield curve in Q1, putting some pressure on bonds. Stocks though, looked through higher interest rates and saw an economy that continues to chug along and defy 7% mortgage rates, higher than acceptable inflation, and a massive debt load. US Large Cap stocks (+10.4%) dominated once again, with seemingly relentless buying led by the big Artificial Intelligence (AI) names like Nvidia. US Small Caps weren’t far behind with a 7.5% gain. International stocks underperformed the US, but still saw good growth for the quarter with Developed countries up 5.4% and Emerging Markets up 1.7%. Commodities saw some strength as well, up 2.3%, and high-yield (junk) bonds were up 1.5% despite rising interest rates, due to their higher interest payments and spread compression vs. other, safer debt like Treasuries. Short-term Corporate Bonds were up 0.6%, fairing better than higher duration bonds as rates rose. Aggregate US Bonds lost 0.7%, Real Estate Investment Trusts were down 1.3% and Emerging Market Local Currency Bonds lost 2.4% for the quarter thanks to higher rates and a stronger dollar.
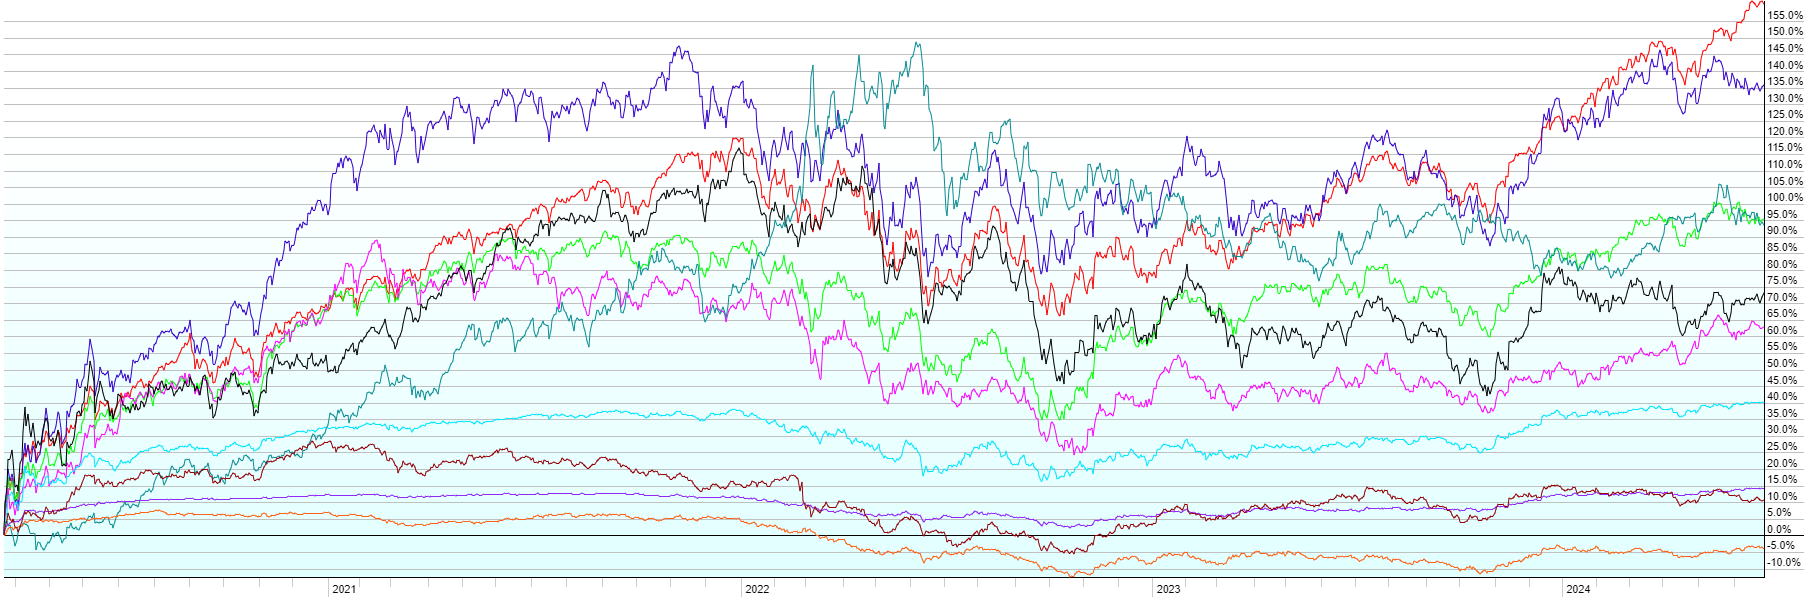
This post contains the usual returns by asset class for this past quarter (by representative ETF), full year 2023, last five years, last ten years, and since the covid low (3/23/2020). While there is still no predictive power in this data, I’ll continue to post this quarterly for those of you that are interested.
Last Quarter (10/1/23-12/31/23)Last 12 months (1/1/23-12/31/23)Since Covid Low (3/23/20-12/31/23)Last Five Years (1/1/19-12/31/23)Last Ten Years (1/1/14-12/31/23)
A few notes:
The rollercoaster continued in Q4, with fantastic returns across the board (excl. commodities, but that’s probably a good thing and it’s another indicator of disinflation), after an up Q2 and a down Q3. Long-term interest rates pulled back as the Federal Reserve appears to have started their pivot toward rate cutting sometime in 2024. They left the door open for further hikes if inflation roars back, but after consecutive soft monthly inflation reports, the Fed is now forecasting three rate cuts (to 4.5-4.75% Fed Funds) by end of 2024. The benign inflation reports and the pivoting Fed sent stocks and bonds off to the races. REITs ended the quarter up more than 18% as the top performer (though that just puts them into the middle of the pack for 2023 as a whole. US Small Caps were up 13.4% with the seemingly ever-raging Large Caps up 11.6%. Foreign Developed (+11%), Emerging Market Bonds (+8.4%), Emerging Market Stocks (+7.1%), and High-Yield Bonds (+7.1%) round out the aggressive side of portfolios. The conservative side also had great returns with US Aggregate Bonds up 6.6% and US Short-Term Corporate Bonds up 4.1%. Commodities (-5.4%), as mentioned above, were the only sore spot for the quarter, with energy prices dropping as the disinflation narrative took hold. It remains to be seen if the Fed can engineer a soft landing for the economy with inflation falling back toward their 2% goal, but without a spike in unemployment and a recession. High interest rates take their toll on economic growth and they work with the “long and variable lags”, about which, the Fed always reminds us. Stocks seem to believe the soft landing is a lock. Bonds seem to believe disinflation is a lock and the Fed is going to go into easing mode. If they’re both correct, 2024 will likely bring more gains with it. If not, it’s going to get interesting, especially for the more expensive areas of the market like US Large Cap stocks.
The IRS has released the key tax numbers that are updated annually for inflation, including tax brackets, phaseouts, standard deduction, and contribution limits. Due to rounding limitations, not all numbers have changed from last year, but tax bracket thresholds have increased by just under 5.5% (higher than usual due to higher than usual inflation over the last year). The notices containing this information are available on the IRS website here and here. Some notable callouts for those who don’t want to read all the way through the update:
Max contributions to 401k, 403b, and 457 retirement accounts will increase by $500 to $23,000 (+$7,500 catch-up, no change from 2023, if you’re at least age 50).
Max contribution to a SIMPLE retirement account will increase by $500 to $16,000 (+$3,500 catch-up if you’re at least age 50).
Max total contribution to most employer retirement plans (employee + employer contributions) increases from $66,000 to $69,000 (+$7,500 catch-up, again for those 50 or over).
Max contribution to an IRA increases from $6,500 to $7,000 (+$1,000 catch-up if you’re at least age 50).
The phase out for being able to make a Roth IRA contribution is $240k (married) and $161k (single). Phase out begins at $220k (married) and $146k (single).
The standard deduction increases by $1500 to $29,200 (married) and by $750 to $14,600 (single) +$1,950 if you’re at least age 65 and single or $1,550 each if you’re married and at least 65.
The personal exemption remains $0 (the Tax Cuts & Jobs Act eliminated the personal exemption in favor of a higher standard deduction and child tax credits).
The child tax credit remains at pre-2021 rules at $2,000 per child, phasing out between $400-440k (married) and $200-220k (single).
The maximum contribution to a Health Savings Account (HSA) will increase to $8,300 (married) and $4,150 (single).
The annual gift tax exemption increases by $1,000 to $18,000 per giver per receiver.
The lifetime gift / estate tax exemption increases to $13,610,000.
Social Security benefits will rise 3.2% in 2024. The wage base for Social Security taxes will rise to $168,600 in 2024 from $160,200.
Updated mileage rates for 2024 are due out later this year.
You can find all of the key tax numbers, updated upon release, on the PWA website, under Resources.
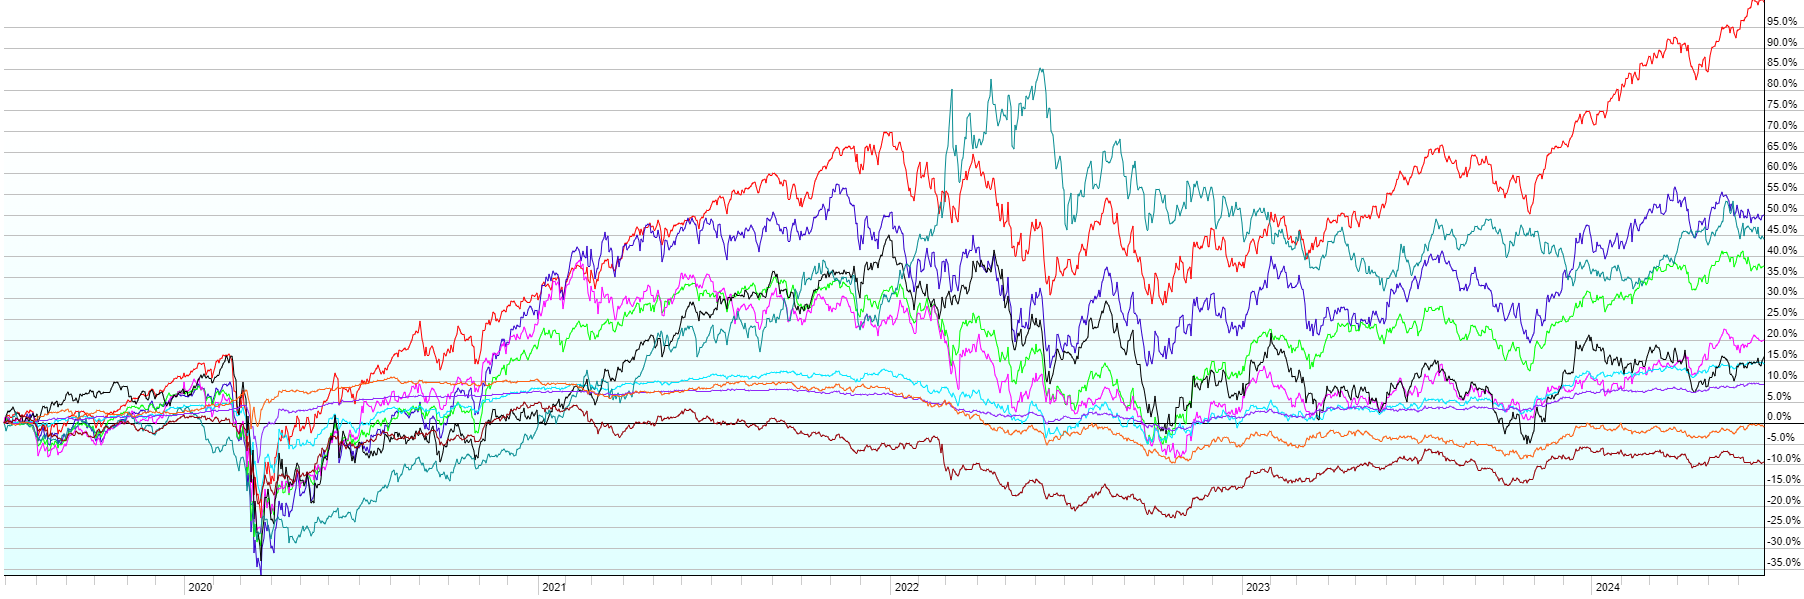
This post contains the usual returns by asset class for this past quarter (by representative ETF), year-to-date, last 12 months, last five years, last ten years, and since the covid low (3/23/2020). While there is still no predictive power in this data, I’ll continue to post this quarterly for those of you that are interested.
Q3 2023 (7/1/23-9/30/23)Year-To-Date (1/1/23-9/30/23)Last 12 Months (10/1/22-9/30/23)Since Covid Low (3/23/20-9/30/2023)Last Five Years (10/1/18-9/30/23)Last Ten Years (10/1/13-9/30/23)
A few notes:
After a stellar July, Q3 ended in disappointing fashion with almost all major asset classes finishing in the red as long-term interest rates hit their highest levels in 15 years. Inflation continues to soften, but the Fed has sustained their hawkish stance indicating the possibility of additional interest rate hikes, while pushing off future cuts well into 2024. The economy continues to chug along, for now, but higher rates are starting to take their toll. Debate rages on as to whether the majority of the hikes of the past 18 months have flowed through the economy or whether the long and variable lags leave the worst yet to come. Job growth has slowed and unemployment has begun to tick up slightly from historically low levels. Mortgage rates approaching 8% have locked up much of the housing market as it becomes tougher and tougher for homeowners to give up their 3% 30-year fixed in favor of another home with an 8% mortgage. Yet GDP growth is likely to be in the very solid 3-4% (annualized) range for Q3 as a whole when it is reported later this month.
Overall for Q3, from best to worst: Commodities (+5.1%) as energy prices spiked; Short-Term Corporate Bonds (+0.2%); High-Yield Bonds (-0.3%); Emerging Market Stocks (-2.8%); US Large Cap Stocks (-3.2%); US Aggregate Bonds (-3.2%); US Small Cap Stocks (-4.6%); Foreign Developed Stocks (-4.7%); Emerging Market Local Currency Bonds (-5.1%); Real Estate Investment Trusts (-8.6%).
While the S&P 500 is still up 12% year-to-date but the rest of the market has lagged with Small Caps only up 4% and Foreign stocks up about 5% overall. Short duration bonds have held their own, up about 2%, but the longer the duration, the worst the performance year-to-date as bond prices move in the opposite direction of rates, offsetting fairly high interest payments.
The longer-term charts continue to show the value of diversification and remaining invested for the long haul. Especially notable is the strong performance of almost all asset classes since the Covid low in March 2020. Note that that low occurred right around peak global fear and the beginning of the lockdowns.
This post contains the usual returns by asset class for this past quarter (by representative ETF), year-to-date, last 12 months, last five years, last ten years, and since the covid low (3/23/2020). While there is still no predictive power in this data, I’ll continue to post this quarterly for those of you that are interested.
Q2 (4/1/23-6/30/23)Year-To-Date (1/1/23-6/30/23)Last 12 months (7/1/22-6/30/23)Since Covid Low (3/23/20-6/30/23)Last Five Years (7/1/18-6/30/23)Last Ten Years (7/1/13-6/30/23)
A few notes:
With jobless claims rising for most of the quarter, softness in many economic indicators, core inflation still running stubbornly hot, and the Fed once again increasing its expectation for further rate hikes (despite a pause at their last meeting), one would think Q2 would have been a messy quarter for stocks. However, just the opposite happened, once again, causing pain for those that think they can time the stock market.
US Large Cap stocks (+8.7%) led the way in Q2, with Large Cap Tech outperforming the asset class as a whole. Artificial Intelligence (“AI”) was the buzz word of the quarter after phenomenal earnings from Nvidia (NASD: NVDA), a leader in the space and the continued rise of ChatGPT and other AI chatbots into everyday life. While the growth in that space overall should be phenomenal, valuations are a major concern with stocks like NVDA. US Small Caps (+5.3%) took second place in Q2, followed by International Developed (+3.2%) and Local Currency Emerging Market Bonds (+2.8%). REITs finished up 1.8%, Emerging Market Stocks up 1.2%, High-Yield Bonds up 0.8%, and Short-Term Corporate Bonds were essentially flat (+0.1%). On the downside this quarter were US Aggregate Bonds (-0.8%) as interest rates were once again higher and Commodities (-3.2%), perhaps giving an indication that inflation is coming down despite being stubbornly high for the last year.
Not shown in the charts above, but growth outperformed value again in Q2. Speculative areas of the market have been heating up in 2023 after getting clobbered in 2022.
While the S&P 500 is now up 15% year-to-date on a price basis, the equal weight S&P 500 is only up 6%. That’s an indication that 2023’s rally thus far has been led by a select group of stocks and while breadth was slightly better during parts of Q2, the average stock is up far less than the market cap weighted indexes are. Also of note this quarter, Apple’s (NASD: AAPL) market cap topped $3 Trillion (yes, with a “T”), the first stock to accomplish that feat.