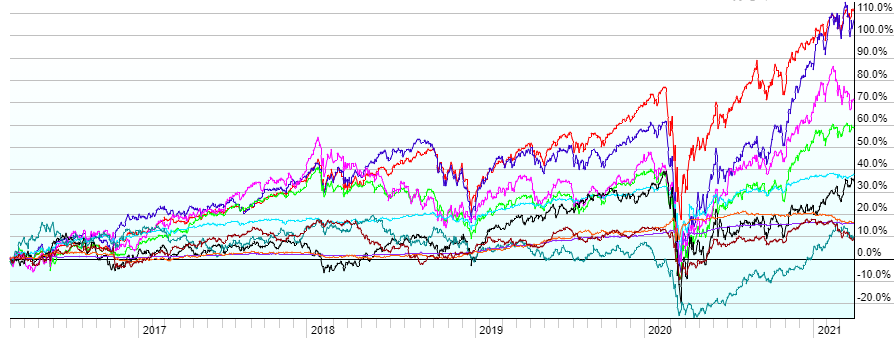
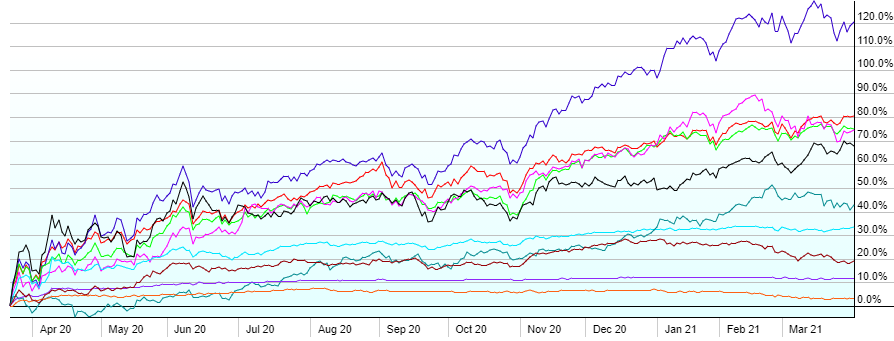
This post contains the usual returns by asset class for this past quarter (by representative ETF), last twelve months, last five years, and last 10 years. There is no year-to-date this quarter since Q1 and year-to-date are the same. I’m also retiring the chart that shows returns since the financial crisis lows of 3/9/2009 and have replaced it with a new chart that shows returns since the covid low (3/23/2020). While there is still no predictive power in this data, I’ll continue to post this quarterly for those of you that are interested.

A few notes:
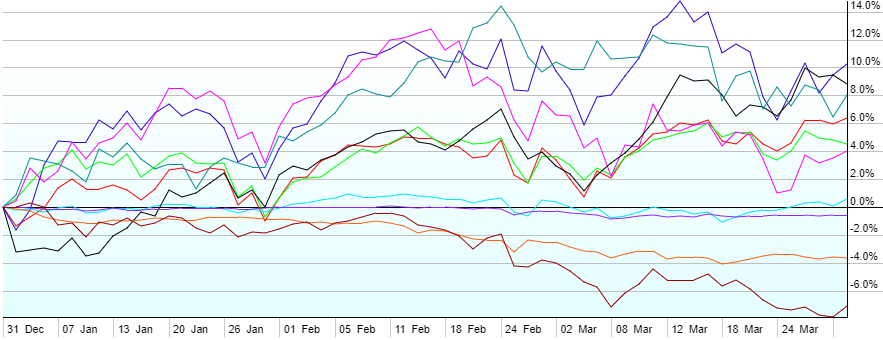
- Another great quarter for equities in Q1, following the spectacular Q4. US Small Caps led the way (+10.3%), followed by REITs (+8.8%), Commodities (+8%) led by energy, US Large Caps (+6.4%), Foreign Developed (+4.5%), and Emerging Markets (+4%).
- It was a tough quarter for Bonds as interest rates rose, especially on longer-dated treasuries. The Federal Reserve indicated that they are likely to hold overnight rates at 0% through at least 2022, but longer term treasuries reacted to the increased likelihood of inflation with the US 10-yr Treasury rising to 1.74%, up from 0.93%, just a quarter ago. High-yield (“junk”) Bonds eked out a positive return (+0.6%), with US Short-Term Corporates losing 0.6%, and US Aggregate Bonds losing 3.6%. Local Currency Emerging Market Bonds fared worst at -7.1%.
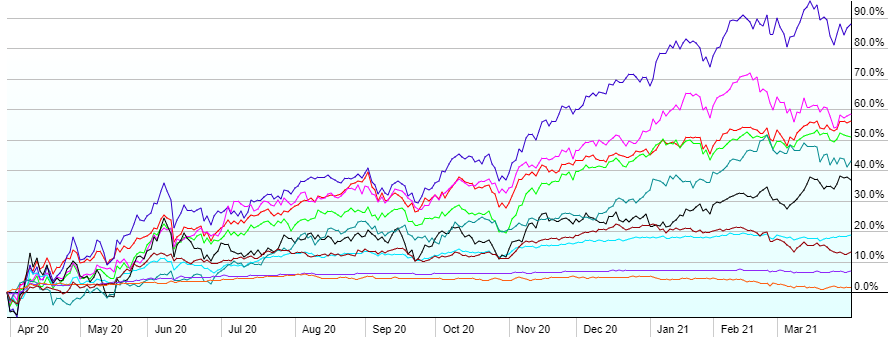
- Over the last 12 months, all assets classes have shown positive returns, amidst the worst pandemic in a century. US Small Caps are now up 120% from their Covid low on 3/23/2020.
