I’ve written a number of these notes over the last 18 years (sheesh… time flies) as an advisor. Banks Teetering (Silicon Valley Bank Goes Under) 2023, Inflation Spike of 2022, Covid 2020, Q4 2018 Meltdown, European Debt Crisis 2014, Fiscal Cliff 2012, Great Financial Crisis 2008/9. Every one of those situations felt terrible. Every one was a crisis at the time, some worse than others, but all resulting in stocks selling off and anxiety rising. Every one of them ultimately resulted in the all-time highs we had on most stock markets just a few months ago. Every one was not reason to panic. Here’s a little secret… this one isn’t a reason to panic either.
Why not panic? Most importantly, when times are not stressful and anxiety is not running high (i.e. when rational thinking prevails), we help our clients set a financial plan, an asset allocation, and a level of risk that they’re comfortable taking. We remind them that risk is what allows risky assets to generate long-term returns that exceed those of risk-free assets. We tell them that in a bad financial situation like the Great Financial Crisis, they are likely to lose 50% of the assets that they have in stocks. We all but guarantee that at some point, something financially bad is going to happen and that 50% loss will occur. It’s actually happened 3 times in the last 25 years! And yet we all agree that the average long-term returns are worth the short-term risk, or almost guarantee, of loss. Why would the occurrence of something that we agreed would almost definitely happen cause anyone to panic? It shouldn’t. Keep in mind that we’re not telling near-retirees to keep 100% of their money in the stock market and simply accept they might (will) lose 50% of it at some point. If you’re nearing retirement and you have all or near all of your money in risky assets like stocks, you’re not a PWA client and you’re doing something very wrong!
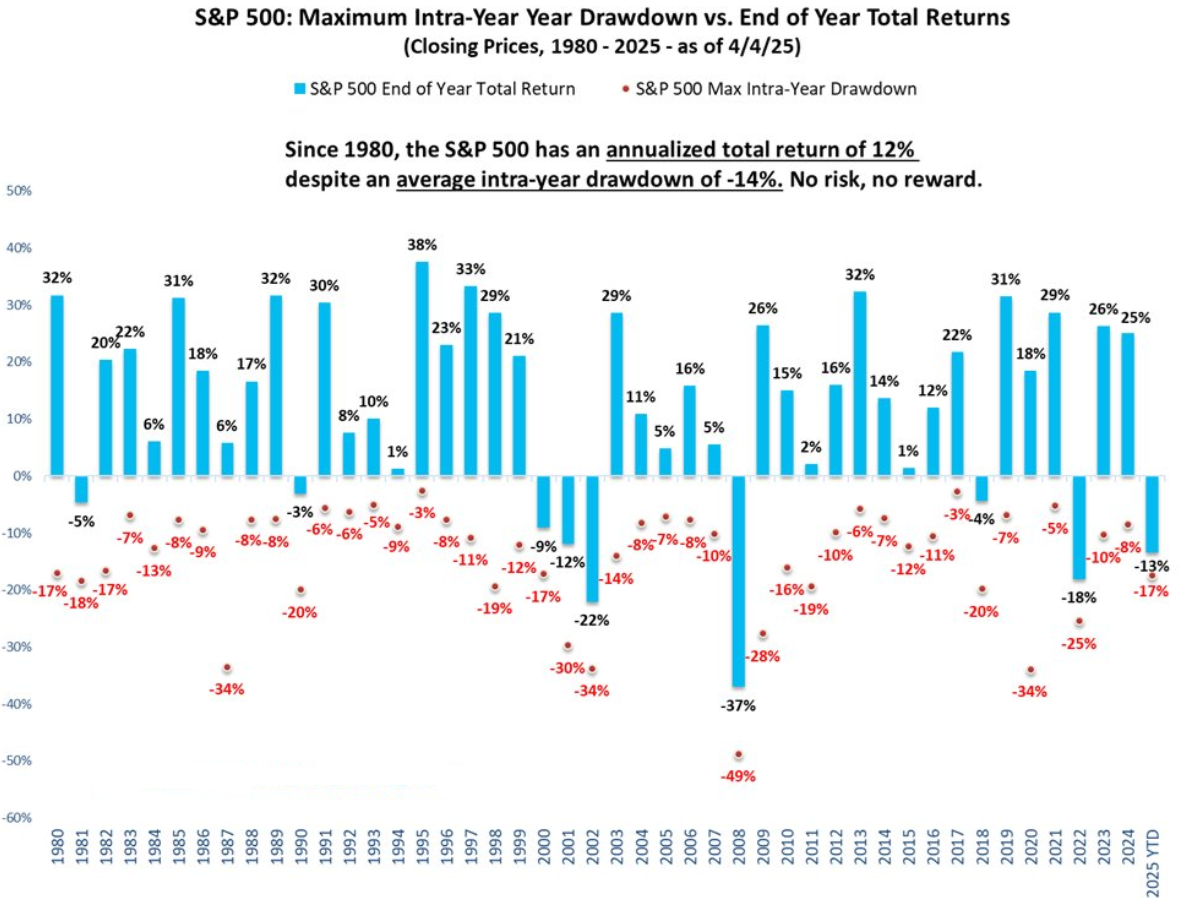
While we can’t see the future, we can look to the past for guidance. Stock market volatility is routine. Charlie Billelo, chief market strategist at Creative Planning, recently updated a JP Morgan chart showing S&P 500 returns by year (avg 12% since 1980) vs. the maximum drawdown in each year (avg 14% since 1980). As of Friday’s close, the S&P500 was down 17% from the high and 13% year-to-date (substantially more on small caps, less on international stocks and bonds have been up). Far from out of the norm. In 2020, we were down 34% from the highs and ended the year up 18% from where we started.
We’ve had a terrible last two days in the stock market, but if you look at previous terrible two days in the stock market, returns have been quite quite good from there in the future.
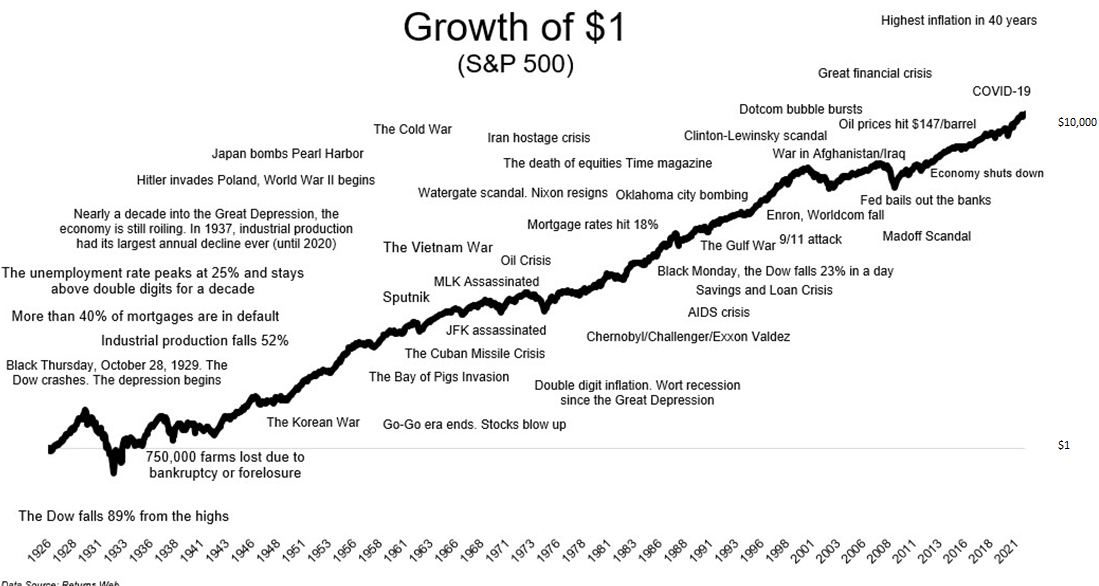
History is filled with potential economic crises (small sampling on the chart below).
The future will also be filled with them. Our debt-laden society makes them worse because even small changes in asset prices cause those that invest on leverage (borrowed money intended to amplify returns) to take large losses. Margin calls then cause forced selling which further magnifies losses. This tends to continue until the overly aggressive investors looking to get rich quick are wiped out, and those patient long-term investors with the ability to rebalance and “buy low” step in. As I type this, futures point to another day of sharp losses tomorrow. Maybe justified by economic policy (a clear policy error in my view… another post on that coming shortly), or maybe just some of that forced selling that tends to follow sharp moves lower in stocks. There’s no way to know. What we do know is that falling stocks are an opportunity to rebalance and “buy low” by selling bonds and buying stocks the same way as rising stocks are an opportunity to rebalance and “sell high” by selling stocks and buying bonds. Volatility, exploited this way, is opportunity. It’s certainly NOT another reason to panic.
This is a Q&A-style primer for the 2024 election. I went with a potentially triggering title intentionally, because that’s what we’re used to on anything election-focused. Rest assured, I’m not warning about anything financially dreadful that is likely to occur as a result of the upcoming election.
Q: What is the “Election Warning” about then?
A: It’s a warning about possible emotional reactions to the results, delays in the results, or financial market volatility around the results of the election. We’re all human. We all panic sometimes. We all make decisions in the midst of a panic. My hope is that by acknowledging this in advance, we can invite logic and calm to the part of the brain that feeds off anxiety. We’re one day out from what the candidates and the media would have you believe is THE MOST IMPORTANT ELECTION OF ALL-TIME. That very well may be the case, especially if things you highly value are at risk of changing or things you’re strongly against are at risk of not changing. I would just note that virtually every presidential election and many mid-term elections are presented as THE MOST IMPORTANT ELECTION OF ALL-TIME. The candidates want you involved to increase the odds that you will donate and ultimately vote. The media wants you interested to increase the odds that you tune in, read, or click (which leads to advertising or subscription revenue). The entire process is designed to put you on edge, especially if you live in a “battleground state” like I do, where we are beaten over the head with divisive, ugly messages for months in advance of the election. There is much at stake that is not financial in nature. I acknowledge that and don’t want to minimize it. But, the anxiety over those non-financial issues can carry over into personal finance, especially if we see markets gyrating due to the same stress-inducing election. A recent poll conducted by the Certified Financial Planning (CFP®) Board, showed that a staggering ~80% of Americans expect their personal finances to deteriorate if their preferred candidate loses the 2024 presidential election. It always feels bad if the other side wins. It’s important to acknowledge that our biases play more of a role in feeling that an election will be financially negative than historical facts do. Here’s another example:
Regardless of your party affiliation, if the President comes from the party that you lean toward, you’re much more likely to have a positive view of economic conditions than if the other party is in power. The effect takes hold very shortly after election day, so it’s not the impact of actual policy changes or legislation driving this result. It’s our biased view of what’s to come.
Q: Isn’t it better for the stock market if one side wins than the other?
A: I haven’t seen any evidence that would lead me to a conclusion one way or the other.
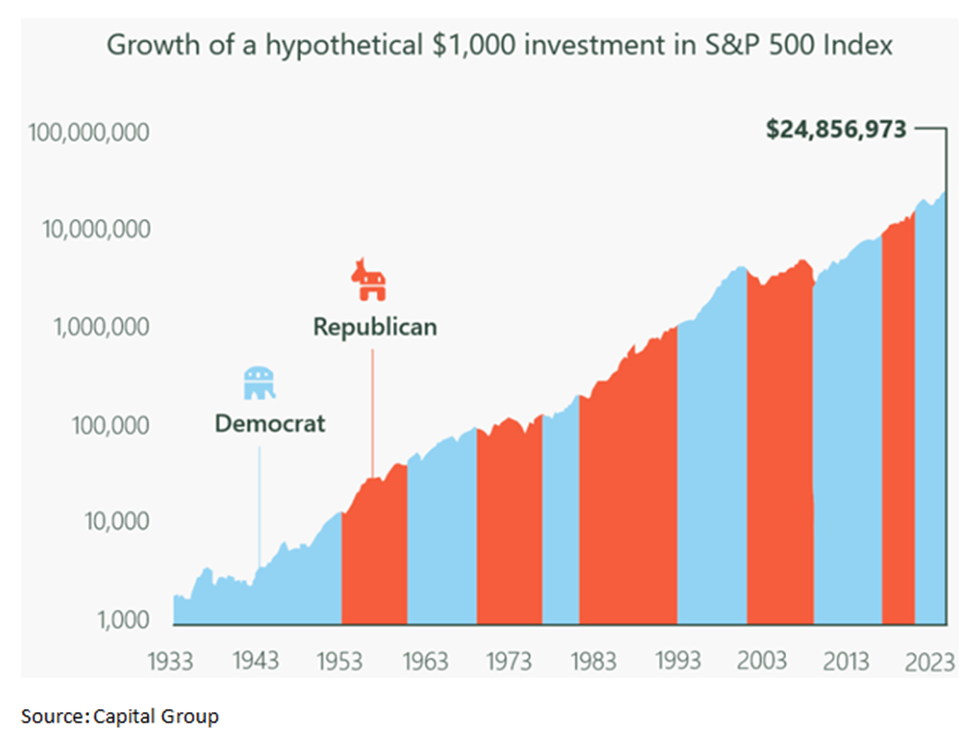
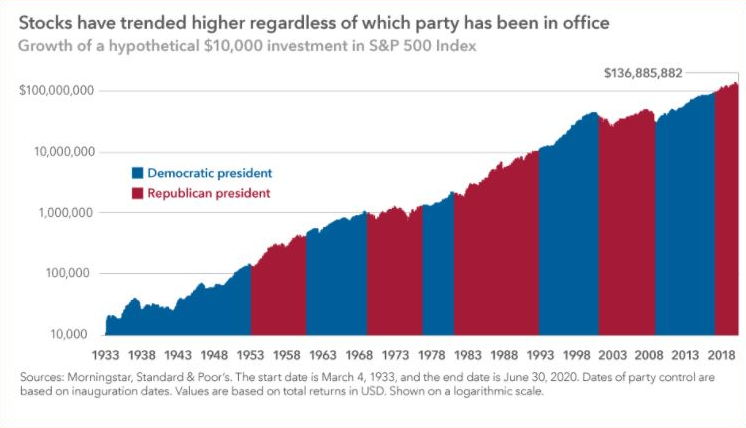
The one thing that is very clear is that stocks tend to go up and the economy tends to grow over the long-term, regardless of who is in the White House.
Note the scale on the left of the chart is not linear. Sure, there are dips here and there, but the takeaway should be clear… over 90 years and through multiple presidents from both parties, a $1000 investment in the S&P 500 grew almost 25,000x to nearly $25M. I went back and checked that because it seemed like maybe a typo. It’s not. It’s the stunning power of compound growth over a long period of time. Instead of worrying about the relatively small dips in the rollercoaster, we just need to zoom out and focus on the extreme upward-sloping ride.
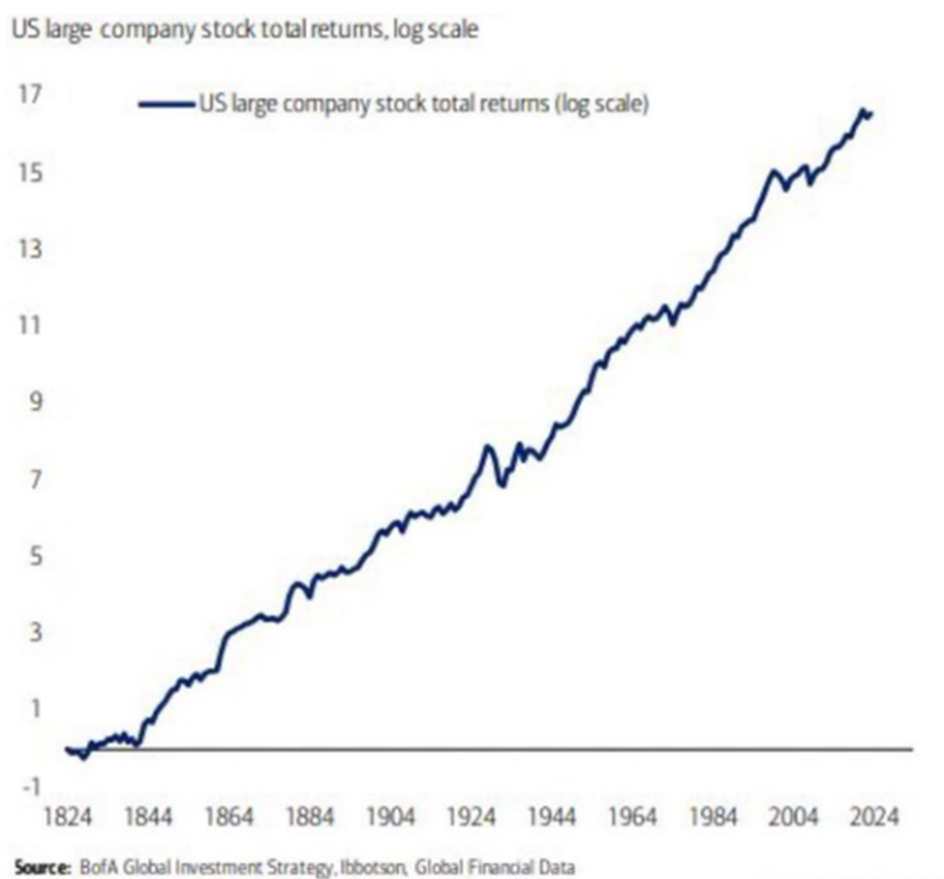
Q: That chart starts just after the Great Depression though. Wouldn’t including that change things?
A: Thanks to Ibbotson Global Financial Data and BofA, we can take this data back to pre-Civil War times and it’s even more impressive. The chart below shows the growth of large US companies for 200 years on a logarithmic scale. That means the values didn’t grow from 0 to 17x over that period. They grew 10^17th times, or 1,000,000,000,000,000,000x! Population growth, productivity growth, and inflation just simply swamp all the minutia over time. You can see the Great Depression on the chart. Notably, you can also see that it mostly just brought growth back in line with the historical trend.
Q: What about the short-term?
A: If you’re invested in stocks for the short-term, you’re just gambling. That doesn’t make sense. Either money is needed for the short-term and shouldn’t be primarily invested in stocks or money isn’t needed for the short-term and the short-term doesn’t matter. It is fair to guess that the stock and bond markets will be volatile as election results come in, especially if election results are delayed. There is an old market adage that states that markets hate uncertainty. Peak uncertainty, from a political perspective, will take place just as polls are closing on election night. Slowly, the uncertainty will be drained from the system and the market will price in victory for one of the candidates, with their likely policy platform, probability adjusted for the odds that it can move through Congress.
Even sector-based predictions are tough to make based on who is president. Richard Berstein recently pointed out that Energy has been the best-performing sector during Biden’s presidency and the Emerging Markets outperformed US Small Caps during Trump’s. Pundits would typically forecast the exact opposite.
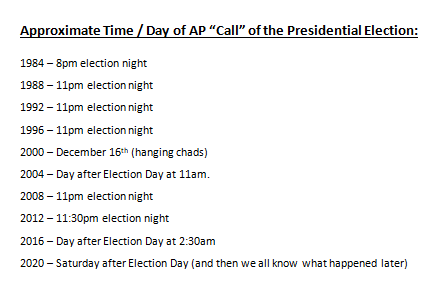
Q: How slowly will that uncertainty be drained? When should we expect election results:
A: We can look back at previous presidential elections for clues:
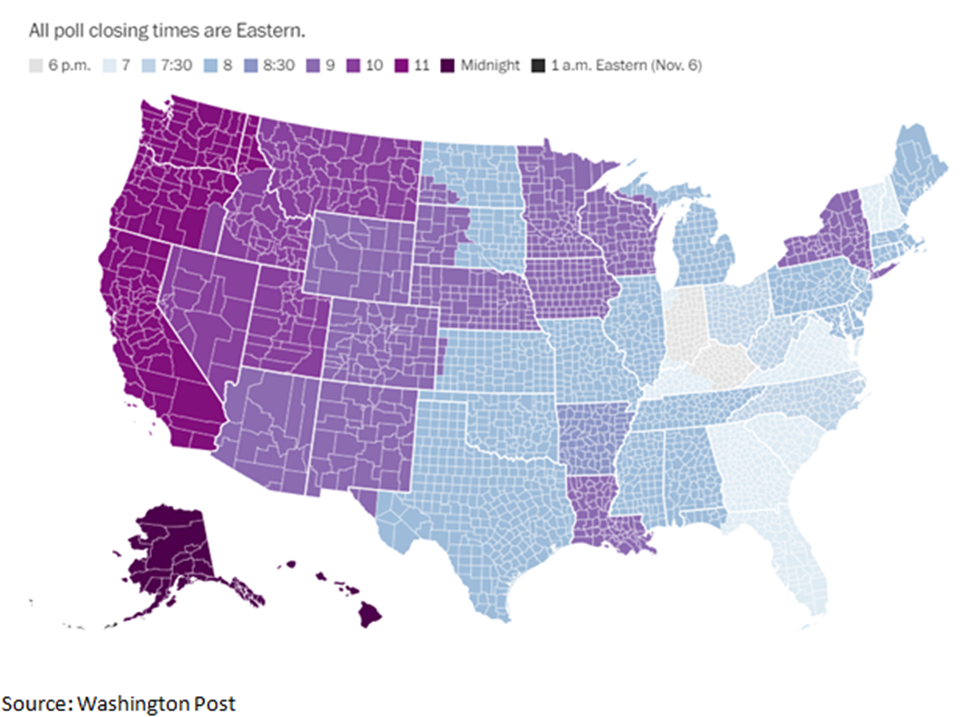
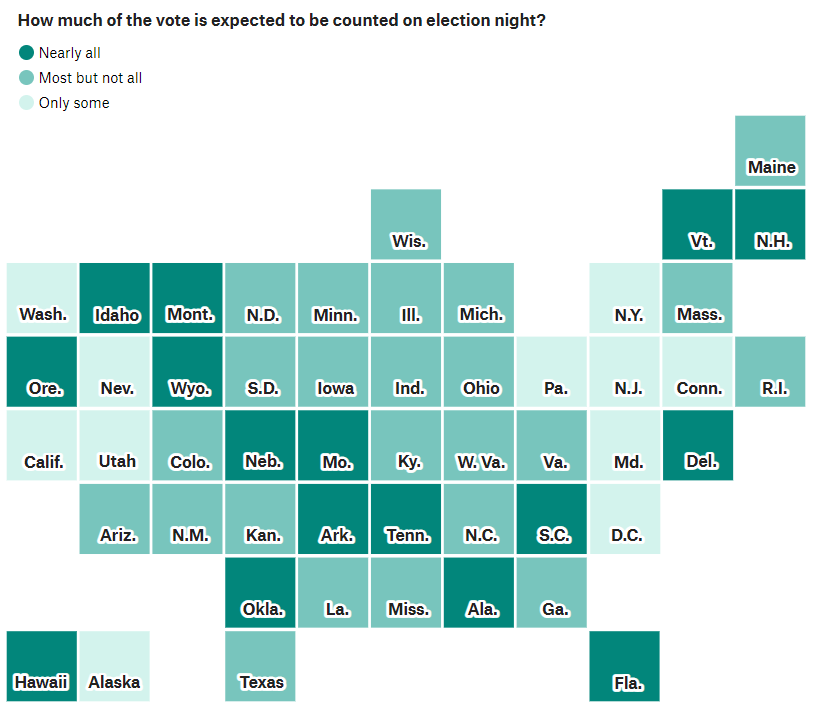
We can also look at how states count ballots, when polls close, and what the news outlets expect in the battleground states:
My notes on ballot counting, by state:
Arizona – multiple referendums, long ballot, lots of manual counting likely needed. Delay could be several days.
Georgia – fairly quick count, but possibly misleading start. Mail-in ballot counting starts at 7am on election day, so the first report will be mostly those ballots, which have historically skewed Democratic. That means a Harris early lead, with Trump closing the gap as more ballots are counted is likely.
Michigan – counted about 45% of the vote by midnight in 2020. Likely to be a close race, so almost definitely won’t be decided election night. Most of the vote should be counted by Wednesday (~95% per NBC News)
Nevada – mails ballots to all active voters. Allows mail-in ballots to be received and counted up to Nov 9. In a close race, results will be delayed at least a few days.
North Carolina – usually a quick count, but storm damage may slow that a bit this year. In 2020, 99% of votes were counted by midnight. Like GA, starts count of mail ballots early in the day, so early results may show a skewed count. Nash County should be the first of ten counties in battleground states that flipped from Trump in 2016 to Biden in 2020 to complete their count around 10pm on election night. Some will view this an early indicator of the 2024 trend. New Hanover is another flip county, expected to complete its count around 10:30pm.
Pennsylvania – can’t start counting mail-in ballots until the polls close. Almost 25% of the votes were mail-in in 2022. However, a lot of investment through the state in making the process better than in 2020 (new machines, more workers, etc.). NBC News expects 98-99% of the vote counted by Wednesday morning.
Wisconsin – fast in the small counties, slower in the large ones which means a possible skewed early lead for Trump given the big city votes should skew Democratic. ~70% of the 2020 vote was in by midnight. Most should be counted by Wednesday (~99% expected per NBC News).
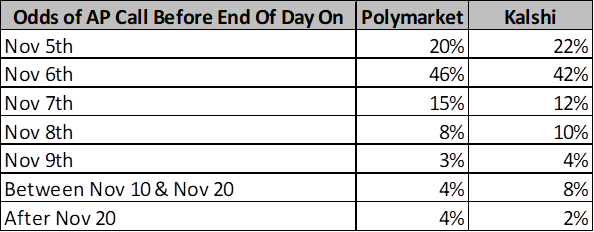
Finally, we can look at prediction markets where real people have real money on the expected result. Here are the odds of when the race will be called:
While I suppose anything can happen, especially after having lived through 2020, Mid-December seems to be the latest possible date of certainty. Under electoral reforms passed after the 2020 election, individual states need to resolve disputes about their results by Dec. 11. If they can’t, the Supreme Court will settle them instead. The Electoral College is scheduled to vote on Dec. 17, which will formalize the result. My opinion: if it’s a blowout, election night is possible, but that seems unlikely given how close the race is (see below). If not, Wed, 11/6 seems most likely. There is potential for it to take several more days, if the race is close and battleground states need recounts or exact counts of all absentee ballots. I think we’ll be pretty certain who won by the end of day on Wednesday, even if the AP hasn’t officially called the race.
Q: You mentioned the market probability adjusts the odds that the winner’s platform can move through Congress. What are the chances the President will be able to do anything at all?
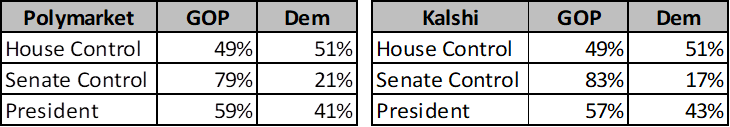
A: The odds are obviously highest if one party controls the presidency and both chambers of Congress. In an atmosphere as divisive as we currently have, it’s unlikely that much will change from current law, at least not without a lot of compromise, if there is a power split. Currently, prediction markets give the following odds:
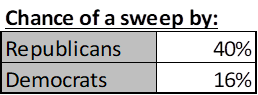
Results are likely to be correlated though. For example, if Democrats outperformed expectations and won the Senate despite only a 21% chance of doing so, it’s almost certain that they also won the presidency and the House. So, the overall chance of full control by each party is somewhat unintuitive from the results above. Since Kalshi has this market available, we can see what’s expected:
Q: What are the differences between the two candidates’ policy positions that might impact the economy, financial markets, and taxes?
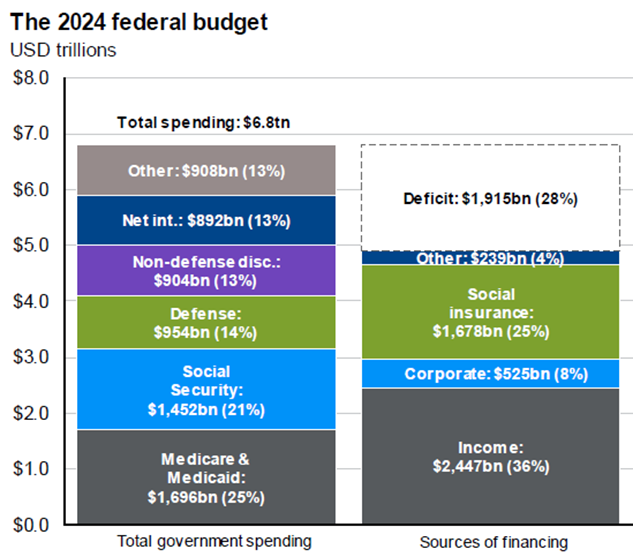
A: A lot of this comes down to the expiration of most of the provisions of the Tax Cuts & Jobs Act (“TCJA”) at the end of 2025. That will happen as the default, i.e. if no new legislation is passed. Notably, the one major provision of TCJA that will not expire in 2025 is the corporate tax rate, currently set to 21%. It would take new legislation to change that.
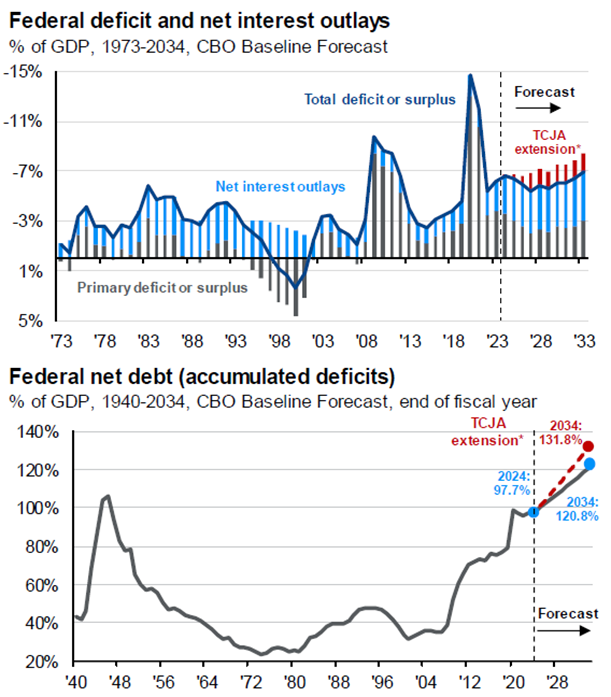
If Republicans sweep, we may see an extension of the full TCJA, perhaps with even lower individual tax rates, and some provisions made permanent. We would likely see more tariffs on foreign goods as a partial Federal revenue raiser, but overall, we’d likely run higher deficits. If deportations of those who entered the country illegally take place on a mass scale, we may see a labor shortage. Combined with tariffs, this could lead to another bout of inflation. Trump has also suggested no income tax on tips, a deduction for auto loan payments, tax-free overtime and Social Security, ending income tax on citizens living abroad, and a host of other nearly impossible-to-pass and administer provisions, even with full control. The corporate tax rate would almost definitely not increase and could decrease further.
If Democrats sweep, we’d almost definitely see many provisions of the TCJA expire. That means higher tax rates, at least on middle-to-upper-income families ($400k/yr in income seems to be the dividing line). It probably means higher taxes on capital gains, higher investment income taxes (Medicare Surtax), and possibly a change that would make death a capital gains realization event, with some exemption. The corporate tax rate would likely increase as well. The higher taxes would help somewhat with deficits, but there would also be an expansion of the Child Tax Credit and possibly more incentives to move toward alternate energy. Overall, the package is likely to be closer to revenue-neutral, meaning the existing deficit might not grow, but it would still exist and drive additional debt.
If power is split, the corporate tax rate would probably stay where it is since a new law to change it would be difficult to pass. Compromise would be needed to prevent TCJA expiration and so we’d wind up with some mix of higher tax rates, and an expanded child tax credit, but probably no changes to capital gains or investment income tax.
As you can see from the above, there are pluses and minuses in all cases. The only consistent theme is that we’re likely to continue to borrow a lot of money to fund the Federal government.
Q: Who is going to win?
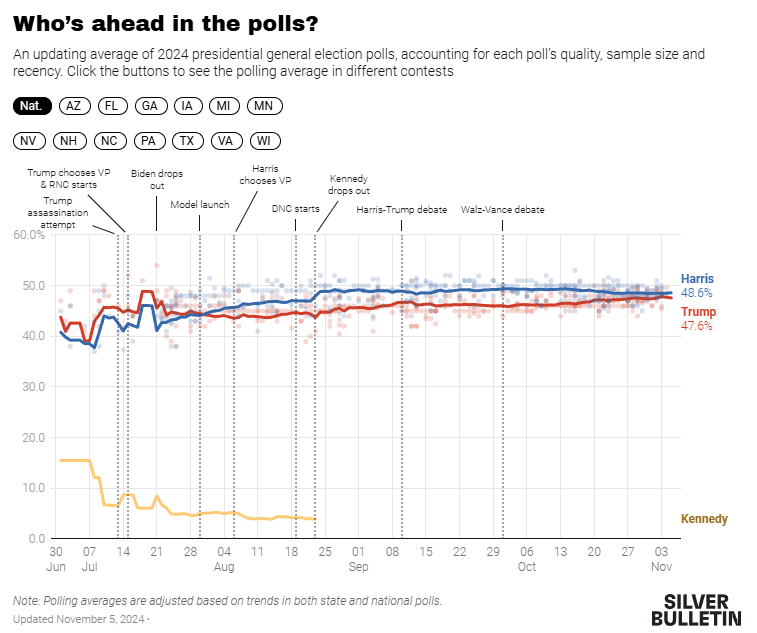
A: I’ve never been more confident in my conclusion in any previous election. That conclusion: “I don’t know.” On the polling side, things are really close and there are a lot of reasons one could infer that polls are undercounting voters on both sides.
Nate Silver’s “Silver Bulletin” does a rigorous aggregation of the various polls, weighting by previous accuracy, by likely vs. registered voters, and by reported margin of error. He then runs a model that simulates different results based on the polling aggregates as well as economic and demographic data and uses the simulation to determine the probability of each possible result. His conclusion, as of 12:30am on Election Day Morning, after pouring through an insane amount of statistical data, was that Harris had a 50.015% chance of winning the election to Trump’s 49.985%. We can’t get much closer than that.
Prediction markets have Trump further ahead, but with some wild gyrations over the past several days. His lead on Polymarket has been as high as 67-33, but currently sits at 59.7-40.3. Kalshi favors Harris slightly more, with Trump ahead 57-43. PredictIt, an older prediction market that imposes fairly small position limits, has a 50-50 tie.
I’ve been following an aggregator called The Super Model, which attempts to put this all together and come up with a weighted total forecast. They have Trump up 56-44.
My take: this is just too close to call. That doesn’t necessarily mean the election will be won by a small margin. It just means that the predictive data we have available doesn’t reveal a conclusion with any level of confidence. The probability margins we’re talking about are equivalent to a 1.5 point spread in a football game. It doesn’t mean the score is necessarily going to be that close, but that’s how close fair odds would be going in.
In summary, we’ll know a lot more in a couple of days about the politics of the next four years. Regardless of the stock market’s short-term reaction, none of it is likely to outweigh the long-term economic growth potential of the US economy. If you feel any election-induced anxiety about financial markets or your financial plan, try to zoom out to the big picture and the long-term. There isn’t a result I can forecast that would lead to me issuing an “Election Warning” for your finances. The 2024 Election will come and go like all the previous ones. And then we’ll start hearing about the MOST IMPORTANT ELECTIONS OF ALL TIME to come in 2026 and 2028.
Given the market volatility around the 2016 election results and election day tomorrow, I thought it would be a good idea to do a Q&A-style post about the election and its potential impacts.
Q: Who’s going to win the presidential election?
A: There’s no way to know for sure at this point, and it’s pretty likely that we won’t know tomorrow night either. But, if you believe the polls and the work of statisticians such as Nate Silver (fivethirtyeight), Biden has about a 90% chance of winning. If you believe the betting markets, Biden has about a 60% chance of winning. These are two very different ways of analyzing the election probabilities. Analyzing the polls is essentially using the estimated margin of error in each poll and weighting the polls by their likely accuracy to determine the mathematical chance of the overall margin of error being big enough for Biden to lose and Trump to win despite the polling averages showing a lead for Biden on average. The betting markets on the other hand are showing the odds that a bettor on Biden would be willing to take (betting $3 for a chance to win $2 more) vs. what a Trump better would be willing to take (betting $2 for a chance to win $3 more). The betting is purely opinion-based and is an average of what all bettors think is going to happen in aggregate. It’s possible that both are somewhat skewed. I don’t really believe the hype around Trump supporters lying to polls, but it’s possible that they’re harder to reach to poll. It’s also well known that the betting markets are male-dominated and that Biden’s lead over Trump is much lower among men than women. Since people often bet in a way that favors what they’d like to see happen, that could skew the odds toward Trump’s side. If I had to guess, I would go somewhere in between and say that Trump has about a 30% chance of winning. That means I’d be willing to bet $3 to win at least $7 on him, or be willing to bet no more than $7 to win at least $3 on Biden. 30% is not zero. The favorite doesn’t always win, as we saw in 2016. A good baseball hitter gets a hit about 30% of the time. There are lots of hits in baseball. There are more outs though.
Q: What about the Senate?
A: 538 gives the Democrats about a 75% chance of taking control of the Senate (including a 50-50 split with a Democratic president), with the most likely scenario being 51-49. Betting markets. again, have the race closer with Democrats having a 60-65% chance of winning. The closest races are in GA (2), NC, IA, ME, and MT. Interestingly, the second GA senate seat is a special election to fill a vacant seat and has multiple candidates from both parties. If a majority isn’t reached, a runoff will take place on January 5, 2021. That could be the seat that decides control of the Senate and a runoff has a decent chance of happening at this point.
Q: What impact will the election results have on the stock market?
A: I don’t think that answer would be clear even if we knew today exactly how every race would turn out. That’s because there are so many potentially offsetting impacts. Here are some of the possible scenarios:
Biden wins, the Democrats take control of the Senate by several seats, and the Democrats keep decisive control of the House – corporate tax rates likely increase (clearly bad for stocks), taxes on higher income individuals likely increase (probably bad for stocks, at least short-term), higher regulation (probably bad for stocks, at least short-term), large stimulus package gets passed (probably good for stocks, at least short-term), more certainty (probably good for stocks), less pressure on global trade (probably good for stocks) less political angst (impeachment, oversight inquiries, etc… probably good for stocks).
Biden wins and the Democrats control the Senate and the House by a small margin – tax picture a little more blurry, regulation still likely to increase, still likely to get a large stimulus package, but allocation to state/local may be a bit smaller, still a boost to global trade, a little less certainty, still less political angst.
Biden wins and the Dems & Republicans each control one chamber – tax changes are unlikely (probably good for stocks as a relief to the alternative), smaller stimulus likely (probably bad or less good for stocks at least short-term), still a boost to global trade, more political angst.
Trump wins and the Dems control both chambers – tax changes very unlikely, large stimulus likely, much more political angst, and global trade challenges continue (worsen?).
Trump wins, the Republicans hold the Senate, and Democrats hold the House (status quo) – tax changes unlikely, stimulus likely smaller with less support for state/local and maybe a big battle to get it done at all, political angst steady, and global trade challenges continue (worsen?).
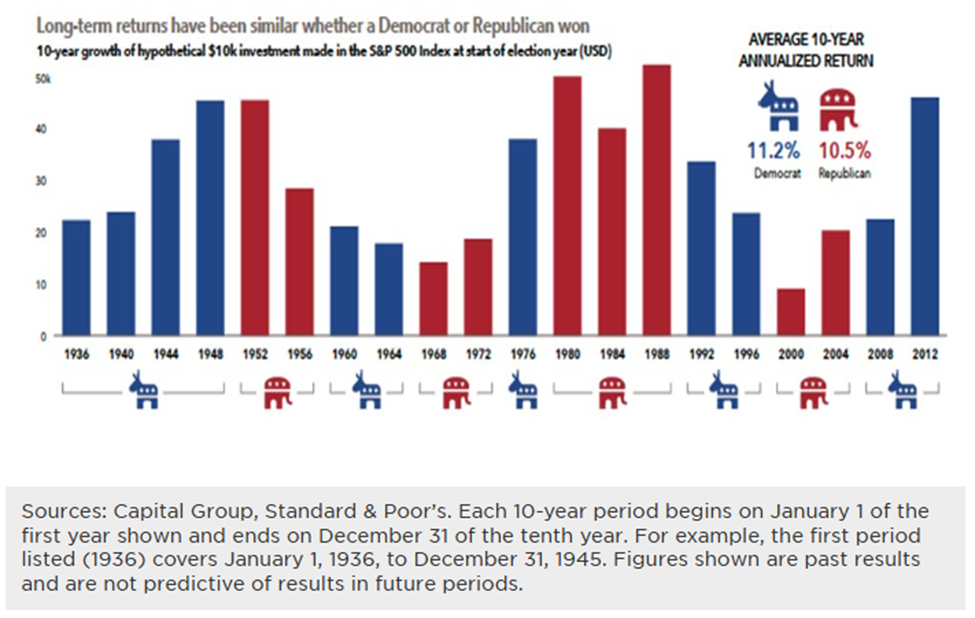
Longer-term, I really don’t think it matters who wins. Take a look at the chart below from Capital Group:
Sure, there are some dips in that chart, but for the most part it’s a steady upsloping line for 87 years regardless of party. By the way, I don’t think one can make any conclusions about which party is better for the market from that chart because the market prices in election results prior to the election and certainly prices in likely policy changes between election and inauguration. The takeaway should be that from a purely stock market perspective, if you zoom out far enough, it doesn’t really matter who wins a single presidential election.
Q: You said that we probably won’t know the result of the election tomorrow. Why not? When will we know?
A: Each state has their own method of counting ballots. The NY Times recently attempted to summarize those methods. The battleground states have some significant differences. Florida, for example, has already counted many ballots received by mail and will release those counts along with in-person early voting by 8:30pm eastern. Election Day ballots will be counted through the night, but no additional mail-in ballots are allowed after 11/3. So we’ll know who won FL by 11/4 morning barring a 2000-like “hanging-chad” incident. Ohio also plans to release pre-election day votes 11/3 evening (by 8pm) and will count election day votes through the night. But, in stark contrast to FL, they will allow ballots postmarked by 11/3 and received by 11/13 to count, and then won’t provide updated results as those ballots come in. As of 11/2, officials say that full statewide results may not be known until the election is certified by the state on 11/28. Since the state knows how many mail-in ballots were sent out, it will know the maximum that could be received, but if neither candidate leads by enough to make it statistically impossible for the mail-in ballots to swing the results, it sounds like Ohio can’t be called until 11/28! 538 recently published a graphic with their opinion of the state-by-state portion of the vote that should be counted on election night:
There is a chance that one of the candidates will have enough of a lead in battleground states, that that ballots received and counted after 11/3 won’t matter and the election results could be known on 11/3 or 11/4. Again, we can rely somewhat on betting markets to gauge opinion of the probability. PredictIt has a wager on when the election will be “called” by both CNN and Fox News. That wager shows the odds of being called on:
Election Day = ~23%
November 4th = ~31%
November 5th = ~7%
November 6th or 7th = ~6%
Later in November = ~18%
December or later = ~15%
Personally, if I were a betting man, I like the combination of after 11/4 for better than even odds. Maybe that’s more of an emotional hedge though. I certainly hope for a result by the 4th!
Q: What’s the market going to do if we don’t know who won or if the election is contested?
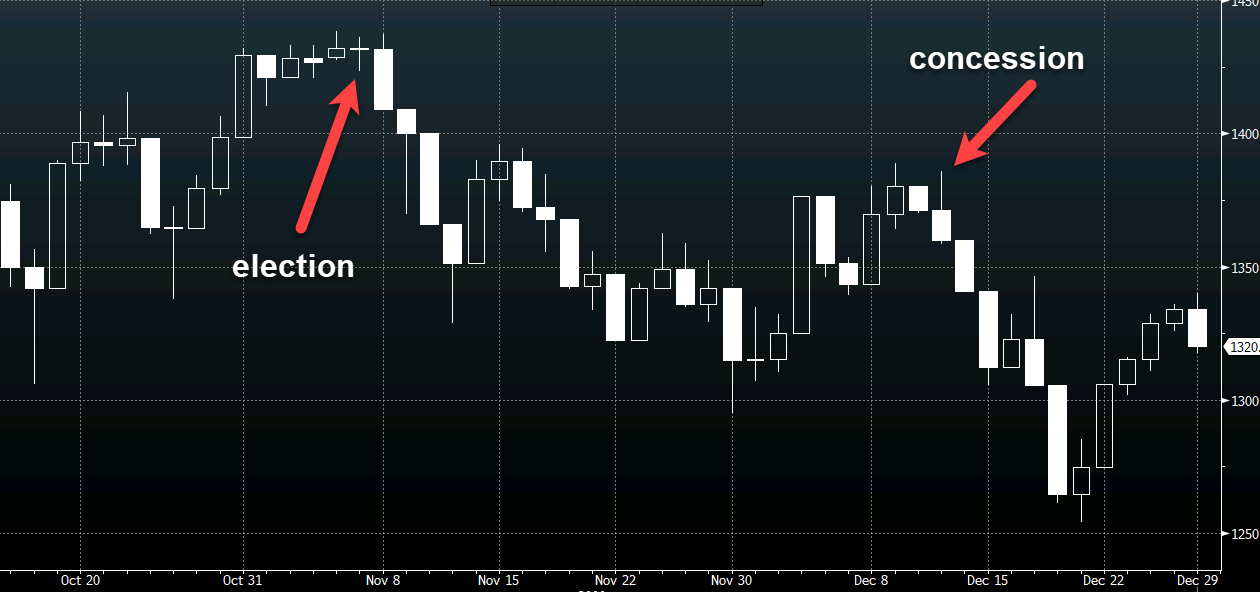
A: We know the stock market didn’t like the 2000 election result process (the FL “hanging chad” election), but it wasn’t exactly catastrophic, as the chart of the S&P 500 shows. It also wasn’t long-lasting.
A contested election that results in not only recounts, but lawsuits that potential swing a result from one candidate to another, etc., could be temporarily much worse. But it’s unlikely that an election with a large margin of victory would be contested and even lower chance that it would reverse the result. So, a very close election with no clear result, that leads to social unrest could certainly hurt financial markets temporarily. Some unrest is likely no matter what the result given current political polarization. The less clear the result is and the more it seems to change, the higher the risk of extreme volatility. I have a high degree of confidence that the next president will be inaugurated on January 20th, regardless of how the election goes. With all of that said, the stock market does a very good job of factoring-in event probabilities and their impacts (including support by the Federal Reserve if things really go off the rails). That means the market is likely to respond very positively, all else being equal, to a clear winner. There’s no way to game the system without a crystal ball or time machine.
Q: Give it to me straight, all-in-all is tomorrow night going to be a mess for the stock market?
A: If you define mess as volatile (bouncing sharply in either/both directions), I’d say that’s much more likely than on an average night. If you define mess as the market falling sharply, I don’t think anyone knows in advance. The better question though is whether what happens tomorrow night matters. I made this short post at about 11pm on election night 2016. Stock futures were down 4.5% at the time and got slightly worse as the result became clear. By 8am, futures were barely down. By the close on 11/9, stocks closed up a little over 1% from the election day close, completely reversing the overnight pullback. By the end of 2016, they were up almost 10% from the day of the election and even now, mid-pandemic, they’re still up over 50% (S&P500) from that election. People are on edge over the election for reasons that far outweigh finance. I get it. The moral of the story here is that there’s little/no reason to let predictions of, or even actual, stock market volatility add to your anxiety.
To summarize:
For the markets, the election is all about probabilities. While Biden is favored to win and the Democrats are favored to narrowly take the Senate, neither is anywhere near a sure thing.
There are dramatic, offsetting impacts to the economy and financial markets, at least short-term, in every possible scenario. Each is currently priced in, probability-weighted.
It may take a while for election results to unfold with certainty.
It may be chaotic in the markets for a while and that could include big down or up moves as a clearer picture of the future arrives.
Long-term, the 2020 election barely matters from a financial point of view. If you’re feeling anxious, try to zoom out for perspective. Stick to your plan. Things are going to be ok.
Note: Many of the links in this post are being updated periodically with new information as election information evolves (538, NY Times, etc.).
Most of you know by now that when you see a “Market Update” post from me, something ugly is happening in the financial markets. This time, it’s the classic fear of a global growth slowdown, with China at the center of the action. There’s plenty of literature out there pointing to all of China’s problems, so I won’t bore you with a recap. Growth there is slowing, dramatically, and there’s little debate about that. For a long time, emerging market growth was thought to be enough to overcome the stagnation that has happened through much of the developed world. Slowing growth (maybe even a real recession?) in Asia, eastern Europe, the Middle East, and Latin America has left financial markets wondering what can drive global growth. Without it, it’s hard to imagine that corporate profits can continue to grow, hiring will increase, spending will rise, and the virtuous cycle will continue. Oil prices have plunged, partially due to the increase in supply led by the US shale revolution, but lately, I suspect it’s again due to demand slowdown fears led by China. While lower commodity prices are beneficial for consumers, it puts a halt on the growth of one of the sources of job gains in the US and provides even more basis for worrying about global growth. Add in fears of the Fed starting to raise rates soon (which almost certainly isn’t going to happen in September now thanks to the recent stock rout), and we have the makings of a meltdown.
[As I write this at 9:30am, the US stock market just opened and the market itself is not functioning properly. There are stocks and funds that opened down 20%+, were halted, and bounced back sharply. It looks a lot like the flash crash of a few years ago. I’d venture to guess that many of those trades will be cancelled by the end of the day. Many stocks did not open on time. Don’t believe what you’re seeing for quotes until that’s all resolved. I suspect the Dow was never really down the 1000+ points that were indicated shortly after the open.]
I don’t know how bad China will get. I don’t know how much fear will beget fear and cause stocks to fall. I don’t know how long it will take for everything to stabilize. What I do know is that China won’t be wiped off the map and that a billion people have a massive amount of productivity to deliver to the world as skills, technology, and resources move from other parts of the world to China. There is a massive portion of the developing world that is living in or on the edge of poverty. Technology is moving so quickly, making the world smaller and smaller and it seems impossible that the disparity in standard of living between the developing and developed worlds can continue forever. Emerging markets will drive growth eventually… It just make take a while to get through some of the policy mistakes their governments have made and to normalize some of the capital flows that have probably put too much of the developed world’s central bank provided liquidity into emerging markets in search of yield. While the media may try to convince you otherwise on a day like today, the world is not ending.
Take this as a gut check. After years without a major fall, there is a tendency to think that stocks go up in good times, and do nothing in bad times. We’ve forgotten that stocks also go down and they tend to go down much faster than they go up. This causes stress when portfolios have not been set up appropriately for your goals. Ask yourself this question: “If the stock market loses half its value as it did twice in the last 15 years, will I still be able to achieve my goals?” The answer to that question is dependent on what your goals are, how soon you need your money, and how much of your portfolio is in the stock market. If your goal is retirement in 20 years, then you’re going to have most of your money in the stock market and downturns are going to be painful, but you (and your portfolio) won’t even remember that this downturn occurred by the time your retire. If you’re looking to buy a house with most of your money in the next couple of years, then most of your money is in bonds, which actually do fairly well when stocks move lower allowing them to offset some of the stock fall and mute the impact on your portfolio. The real concern for investors should be whether or not you’ve really evaluated your goals and communicated them to your advisor. As long as we’re on the same page, your portfolio is allocated in a way that the stock market falling 10%, 20%, or even more isn’t going to ruin you. That doesn’t mean your portfolio won’t go down… I assure you it will and that’s a necessary risk in order for it to go up in the good times. It means that you should still be able to achieve your goals even if stocks fall sharply over the short term. As I posted on Twitter on Friday, “If it matters to you that stocks fell today / this week, you’re gambling, not investing.” If you feel like you’re gambling and you’re worried, please contact me. It means you’re letting your emotions get the best of you (and I’m happy to talk you off the ledge) or that your portfolio isn’t in line with your goals (which means we really need to talk).
I’ll conclude with something no one wants to hear while the market is falling, but everyone realizes is true eventually. Investing at lower prices actually increases long-term wealth and the probability of achieving your goals. In my most rational moments (which are admittedly hard when the entire world’s stock markets are down 10%+ over two days), I cheer when the market falls and get more nervous when it rises because I know your long-term goals (and mine) have a better chance of success when prices are lower and we can invest more money at those lower prices (see The Value Of Volatility post from 2013). Would you rather your next 401k contribution get invested at last week’s higher prices or this week’s lower prices? Buyers should always want prices to be lower, even if it doesn’t feel good at the time. On days like today, which definitely don’t feel good, please keep that in mind.
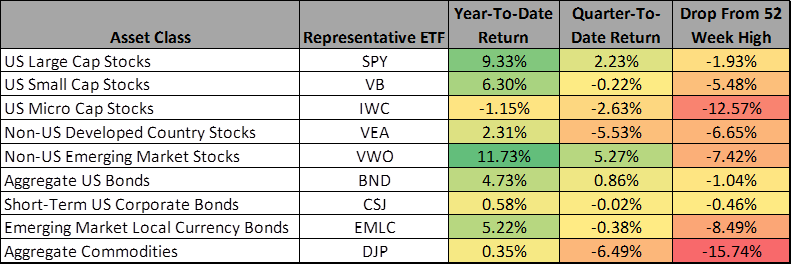
While the Dow and S&P 500 have done fairly well this year and have held up decently so far this quarter, other asset classes that aren’t in the headlines, but are part of a well-diversified portfolio, have fared far worse. Some classes, like Commodities and Microcap Stocks have even fallen enough to be considered in a “correction” by its classical definition (10% down from highs). The table below shows (through 9/22) year-to-date and quarter-to-date returns for a select group of ETFs that represent major asset classes, along with their decline from their high over the last 52 weeks.
There’s no way to know whether this divergence in returns is predictive of poor returns to come, or if a reversion to the mean is more likely which would have underperforming asset classes begin to outperform. I just wanted to quickly point out that while the perception is that the market is at all-time-highs, this is really only true if you’re looking at US Large Cap Stocks in isolation.
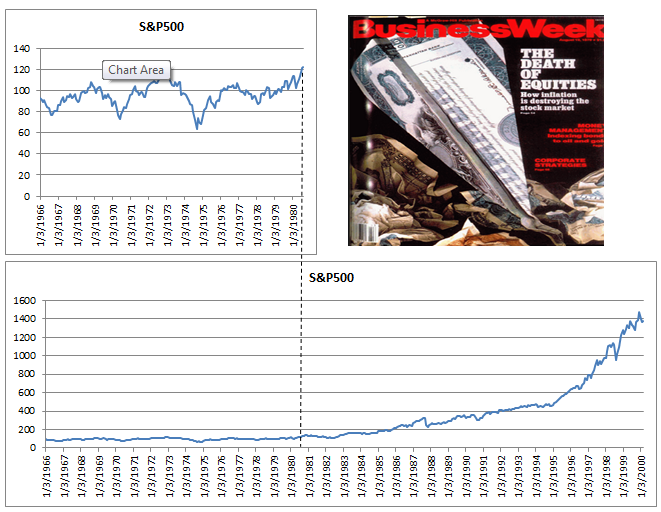
If you watch business news TV, read the business section of the newspaper, or follow business/investing websites, you’ve undoubtedly heard a lot of “due for a pullback”, “too much too fast”, “need a correction” and “not safe to invest at all-time highs” lately. Mind you, many of these predictions started when the stock market was 10-20% lower than it is today. While I continue to believe predicting the short-term direction of the market is a fool’s game, and I’m definitely not saying it’s going to happen this way again, it’s worth looking at the last time in history that the stock market moved essentially sideways for 13-14 years and then broke out to new highs. The first chart below shows the S&P 500 from 1966 to mid-1980. Essentially no gains for over a decade, two massive drops (one near 50%). This was the period of the infamous Businesweek cover that claimed “The Death Of Equities”. The second chart shows the same S&P 500 index starting from the same point, but extending to 2000. If investors were too scared in 1980 to invest in the stock market, or were waiting for a correction to invest because it was breaking to new highs, they may have missed the run from 120 to 1500 on the S&P 500 (1150% return).
The moral of the story is not that you should invest now because the stock market is going to go up for the week, month, year, or decade. It’s that trying to use the recent past (or even 14 years of past) to determine the value of the stock market today is useless. It may even be worse than useless… it could lead you to feel that the market it overvalued, right before it increases 1150% over the longest bull market in history.