Q3 2025 Returns By Asset Class

This post contains the usual returns by asset class for this past quarter (by representative ETF), year-to-date, last 12 months, last five years, and last ten years. While there is still no predictive power in this data, I’ll continue to post this quarterly for those of you that are interested. 

Last Quarter (7/1/2025 – 9/30/2025)
Year-To-Date (1/1/2025 – 9/30/2025)
Last 12 months (10/1/2024 – 9/30/2025)
Last 5 Years (10/1/2020 – 9/30/2025)
Last 10 Years (10/1/2015 – 9/30/2025)

A few notes:

Q3 2025 was another solid quarter for investment returns, with all major asset classes finishing in the green. The quarter was led by Emerging Market Stocks (+10.1%), followed by US Large Caps (+8.1%), US Small Caps (+7.6%), Foreign Developed (+5.6%), Commodities (+4% after a mid-quarter dip), US Real Estate Investment Trusts (REITs) (+3.6%), Emerging Market Bonds (+2.2%), US High-Yield Bonds (+2.1%), US Aggregate Bonds (+2%), and US Short Term Corporate Bonds (+1.7%). During Q3, Congress passed and the president signed the One Big Beautiful Bill (OBBB) Act. More on that here. The Fed also started a new rate cutting cycle with a quarter point cut to 4-4.25% as inflation has eased while the job market has softened a bit. They insist this isn’t a sign of bad things to come, but is instead moving rates back toward neutral from their current, somewhat restrictive level. Markets expect another two quarter-point cuts before the end of the year.

Q2 2025 Returns By Asset Class

This post contains the usual returns by asset class for this past quarter (by representative ETF), year-to-date, last 12 months, last five years, and last ten years. While there is still no predictive power in this data, I’ll continue to post this quarterly for those of you that are interested. 

Last Quarter (4/1/2025 – 6/30/2025)
Year-To-Date (1/1/2025 – 6/30/2025)
Last 12 Months (7/1/2024 – 6/30/2025)
Last 5 Years (7/1/2020 – 6/30/2025)
Last 10 Years (7/1/2015 – 6/30/2025)

A few notes:

Q2 2025 experienced a lot of volatility on its way to solid overall returns. The quarter started with President Trump announcing “reciprocal tariffs” on virtually all countries on “Liberation Day”, April 2nd. Markets reacted very poorly, especially US Stocks. My thoughts from early April are here and here. Markets (US Stocks down 11-13% over that first week of April and lots of stress in the US Treasury market) seemed to force the administration’s hand toward de-escalation. A new openness toward negotiation of new trade deals sent markets into recovery mode. Foreign Stocks maintained the outperformance they showed in Q1, but all asset classes rallied, at least somewhat, for the last 12 weeks of the quarter. From best to worst: Foreign Developed Stocks (+13%) as the dollar plunged to a 3+ year low, US Large Caps (+11%), Emerging Market Stocks (+10%), Emerging Market Bonds (+8%), US Small Caps (+7%), High-Yield Bonds (+4%), Short-term Corporate Bonds (+2%), Aggregate US Bonds (+1%), Real Estate Investment Trusts (REITs) (-1%), and Commodities (-4%). REITs struggled toward the end of the quarter on concerns over office REITs in NYC after a self-proclaimed Socialist won the Democratic Primary for mayor. Commodities struggled after a cease-fire between Israel & Iran erased the premium that had settled into energy prices over the previous few weeks. These lower commodity prices, though, helped other assets to rally into the end of the quarter given possibly lower future inflation as a result. Lower inflation gives the Federal Reserve more cover to cut interest rates, which would provide a tailwind for asset prices. Markets are now pricing in about 2 1/2 quarter point cuts (63 basis points) between now and December, which would take Fed Funds down to ~3.75% and savings interest rates down to the low 3% range. Unfortunately for the housing market, this may not translate into lower long-term rates (a requirement for lower mortgage rates) if the Fed follows the forecasted path for the short-term. Q3 will be interesting as we could get our first Fed rate cut of the year and need to follow the progress of the One Big Beautiful Bill through Congress. If it passes, higher deficits are a near certainty and with that will come pressure on long-term interest rates to move higher. There will be lots of tax implications as well, some retroactively effective in 2025. I will post a summary of the key tax provisions if/when the Bill nears passage.

Q1 2025 Returns By Asset Class

This post contains the usual returns by asset class for this past quarter (by representative ETF), last 12 months, last five years, and last ten years. While there is still no predictive power in this data, I’ll continue to post this quarterly for those of you that are interested. 

Last Qtr (1/1/2025 – 3/31/2025)
Last 12 Months (4/1/2024 – 3/31/2025)
Last 5 Years (4/1/2020 – 3/31/2025)
Last 10 Years (4/1/2015 – 3/31/2025

A few notes:

Q1 2025 was a flat-to-slightly-up quarter for most diversified portfolios despite all the news of a slowing US economy and the unknown (but almost definitely negative short-term) impact of tariffs. Diversification really paid off for the US investor. US stocks suffered over the quarter (Large Caps -4.3%, Small Caps -7.3%), but Foreign Stocks, Bonds, and Commodities performed well, offsetting those losses. Commodities (+10%) led the asset classes that we track in this quarterly message, with Foreign Developed Stocks (+6.8%) not far behind. Emerging Markets faired well too, with Emerging Market Local Currency Bonds up 4.3% and Emerging Market Stocks up 2.8%. The Federal Reserve held the Fed Funds rate steady at 4.25-4.5% during Q1, but long-term rates fell on fears of a coming recession and lower rates mean relatively strong performance for bonds. US Aggregate Bonds were up 2.8%, with Short-Term Corporate Bonds up 2% and US High Yield Bonds up 1.2%.

Q4 2024 Returns By Asset Class

This post contains the usual returns by asset class for this past quarter (by representative ETF), total 2024, last five years, last ten years, and since the covid low (3/23/2020).  While there is still no predictive power in this data, I’ll continue to post this quarterly for those of you that are interested. 

Last Quarter (10/1/24-12/31/24)
Last year (1/1/24-12/31/24)
Since Covid Low (3/23/20-12/31/24)
Last 5 Years (1/1/20-12/31/24)
Last 10 Years (1/1/15-12/31/24)

A few notes:

Q4 2024 was an overall down quarter for most diversified portfolios as international markets struggled post-US election, the US Dollar rallied, and long-term interest rates spiked as the inflation stagnated and the Fed continued to cut overnight rates. US stocks had a solid quarter with Large Caps up 2.5% and Small Caps up 1.7%. All other asset classes that we track for this ongoing post were down though including High-Yield Bonds (-0.1%), Short-Term Corporate Bonds (-0.4%), Commodities (-0.5%), US Aggregate Bonds (-3.1%), Emerging Market Stocks (-5.7%), Emerging Market Bonds (-7.1%), US Real Estate Investment Trusts (-7.7%), and International Developed Stocks (-8.1%).

Q3 2024 Returns By Asset Class

This post contains the usual returns by asset class for this past quarter (by representative ETF), year-to-date, last 12 months, last five years, last ten years, and since the covid low (3/23/2020).  While there is still no predictive power in this data, I’ll continue to post this quarterly for those of you that are interested. 

Last Quarter (7/1/24-9/30/24)
Year-To-Date (1/1/24-9/30/24)
Last 12 Months (10/1/23-9/30/24)
Since Covid Low (3/23/20-9/30/24)
Last 5 Years (10/1/19-9/30/24)
Last 10 Years (10/1/14-9/30/24)

A few notes:

Q3 2024 was a fantastic quarter for financial markets as the US economy chugged along, inflation continued to ease around the world, China launched new stimulus measures to strengthen it’s economy, and the Federal Reserved began a rate cutting cycle with a 50 basis point reduction in the Fed Funds rate. Rather than waiting for severe economic weakness to cut rates, as they have typically done in the past, the Fed decided to cut aggressively and begin to ease up on the brakes they’ve been applying to the economy as a way of fighting inflation. All asset classes that we follow in this quarterly message posted gains, led by Real Estate Investment Trusts (+17%). In the middle of the pack, but still with strong returns, were Emerging Market Stocks (+9.7%), US Small Caps (+9.1%), Emerging Market Bonds (+8.1%), Foreign Developed Stocks (+7.1%), US Large Cap Stocks (+5.8%), US High-Yield Bonds (+5.7%), US Aggregate Bonds (+5.2%), and Short-Term Corporate Bonds (+3.8%). Bringing up the rear were Commodities, still positive at 0.6% despite a pull-back in the energy sector.

Q2 2024 Returns By Asset Class

This post contains the usual returns by asset class for this past quarter (by representative ETF), year-to-date, last 12 months, last five years, last ten years, and since the covid low (3/23/2020).  While there is still no predictive power in this data, I’ll continue to post this quarterly for those of you that are interested. 

Last quarter (4/1/24-6/28/24)
Year-To-Date (1/1/24-6/28/24)
Last 12 Months (7/1/23-6/28/24)
Since Covid Low (3/23/20-6/28/24)
Last 5 Years (7/1/19-6/28/24)
Last 10 Years (7/1/14-6/28/24)

A few notes:

Mixed results across asset classes for Q2 kept most diversified portfolios relatively steady in Q2 2024. Emerging market stocks and US Large Cap (led especially by mega caps in tech/AI) outperformed with 5.2% and 4.4% returns respectively. On the flip side, US Small Caps were down 4.2% for the quarter with only ~38% of the stocks in the Russell 2000 closing higher than they started the quarter. In between the best and the worst were Commodities (+3.1%), US Short-term Corporate Bonds (+0.9%), US High Yield (+0.7%), US Aggregate Bonds (+0.1%), Foreign Developed Stocks (-0.6%), Emerging Market Bonds (-1.6%), and US Real Estate Investment Trusts (-1.9%).

Q1 2024 Returns By Asset Class

This post contains the usual returns by asset class for this past quarter (by representative ETF), last 12 months, last five years, last ten years, and since the covid low (3/23/2020).  While there is still no predictive power in this data, I’ll continue to post this quarterly for those of you that are interested. 

Last quarter (1/1/24-3/28/24)
Last 12 months (4/1/23-3/28/24)
Since COVID Low (3/23/20-3/28/24)
Last 5 years (4/1/19-3/28/24)
Last 10 Years (4/1/14-3/28/24)

A few notes:

A steadying of inflation at a level higher than the Fed’s 2% target pushed back market expectations for interest rate cuts in the first half of 2024. This led to higher rates across the yield curve in Q1, putting some pressure on bonds. Stocks though, looked through higher interest rates and saw an economy that continues to chug along and defy 7% mortgage rates, higher than acceptable inflation, and a massive debt load. US Large Cap stocks (+10.4%) dominated once again, with seemingly relentless buying led by the big Artificial Intelligence (AI) names like Nvidia. US Small Caps weren’t far behind with a 7.5% gain. International stocks underperformed the US, but still saw good growth for the quarter with Developed countries up 5.4% and Emerging Markets up 1.7%. Commodities saw some strength as well, up 2.3%, and high-yield (junk) bonds were up 1.5% despite rising interest rates, due to their higher interest payments and spread compression vs. other, safer debt like Treasuries. Short-term Corporate Bonds were up 0.6%, fairing better than higher duration bonds as rates rose. Aggregate US Bonds lost 0.7%, Real Estate Investment Trusts were down 1.3% and Emerging Market Local Currency Bonds lost 2.4% for the quarter thanks to higher rates and a stronger dollar.

Coronavirus

Switching to a new Q&A format for most blog posts as I think it makes them easier to read and allows me to include questions that clients have asked. If you have more questions on a related (or really any topic), please let me know and I will try to include them in future posts.

Q. What is this post about?

A. The economic, financial market, and personal finance impact of the “coronavirus” (covid-19).

Q. Aren’t there more important impacts from a viral outbreak than those related to finance?

A. Yes. It’s not lost on me that there are much greater concerns in public health than in finance when a viral outbreak hits. I am sensitive to the tens of thousands of people who are sick and the thousands who have or will die. My job is in finance though, so I will leave the health and social issues to the experts in those fields and focus here on my scope of knowledge and understanding.

Q. How has covid-19 impacted financial markets?

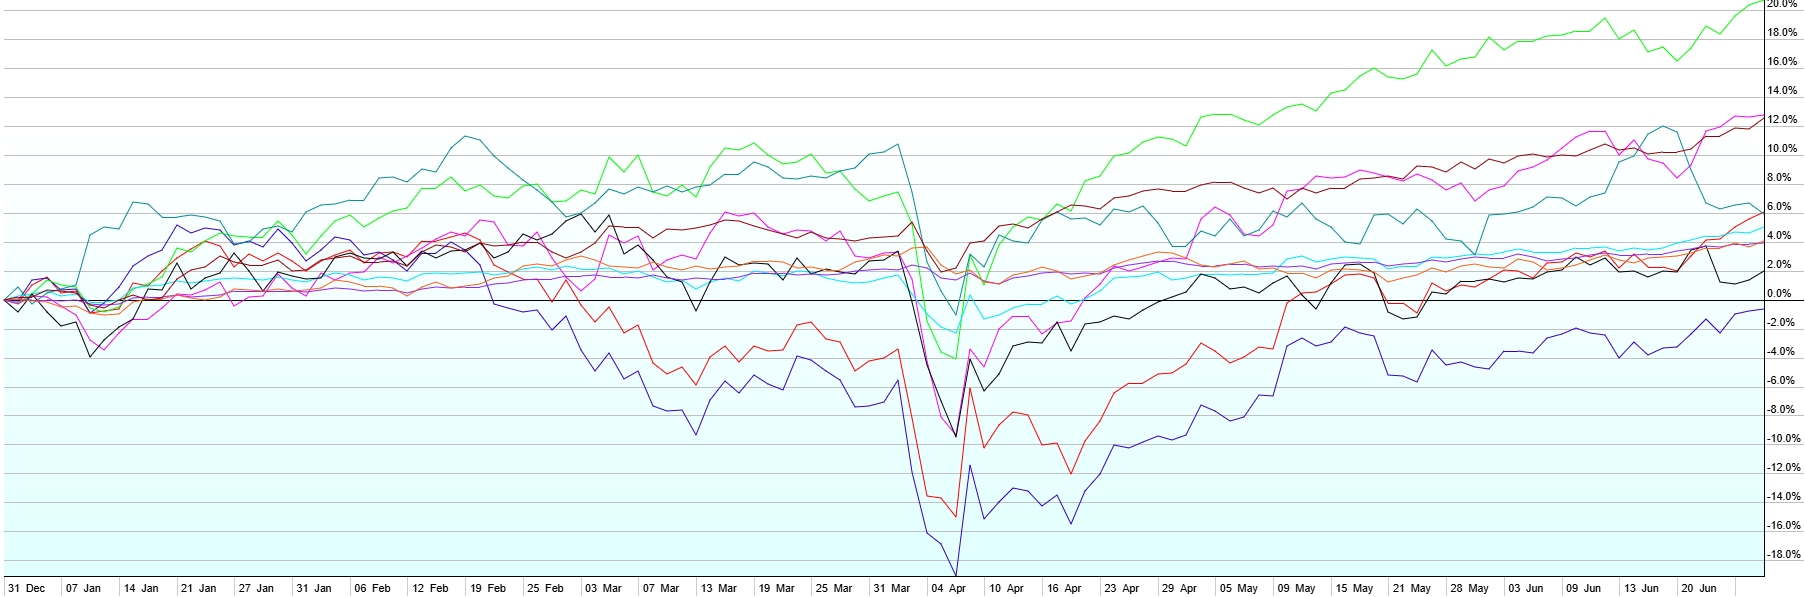
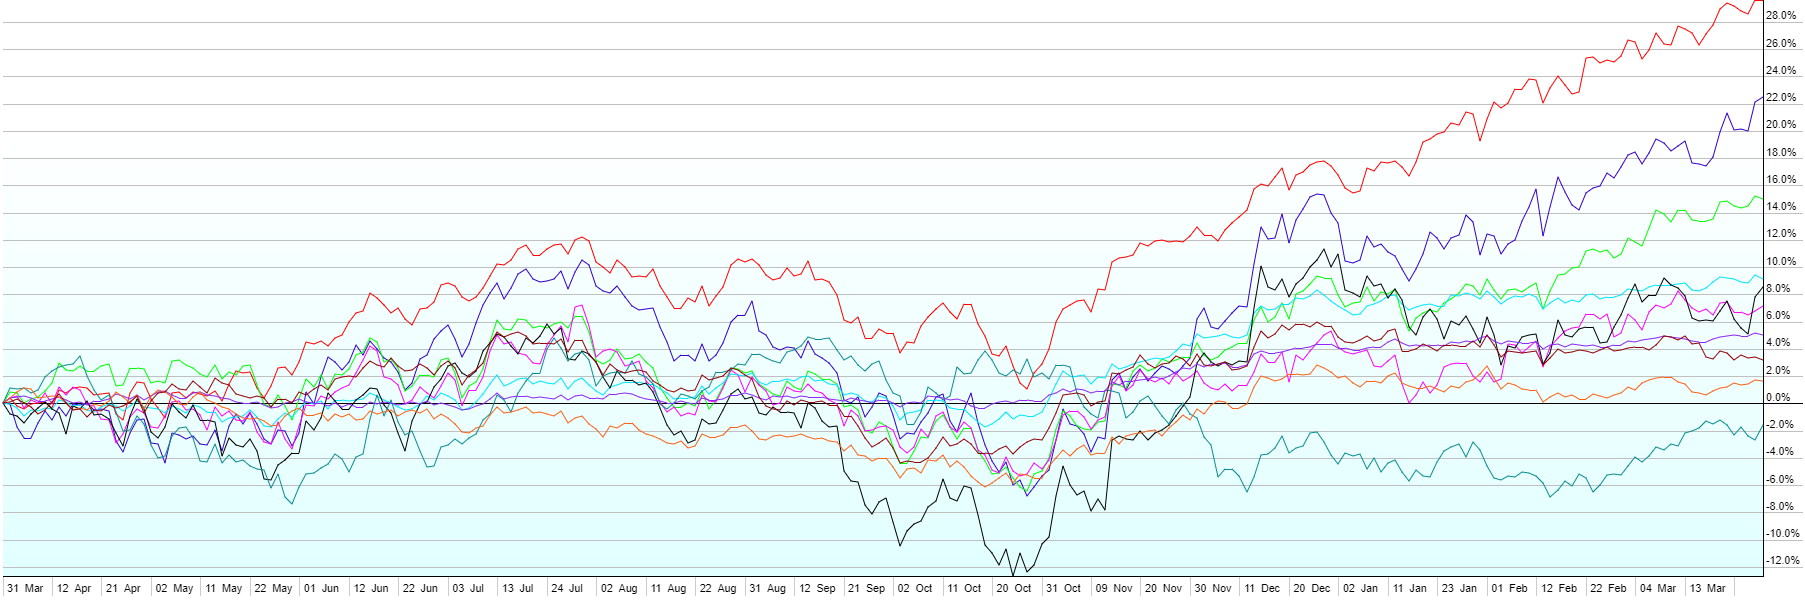
A. The impact of the Coronavirus (covid-19) on financial markets over the past week has been sharp and swift. Long-term interest rates have fallen sharply (US 10-year treasury hit an all-time low today of 1.243%) causing bond values to increase, while stocks around the globe have fallen. On average, stocks are down about 10% over the last week around the world, with some areas, sectors, and asset classes down much more than that.

Q. We were just at all-time highs though, right? So 10% from all-time high isn’t so bad is it?

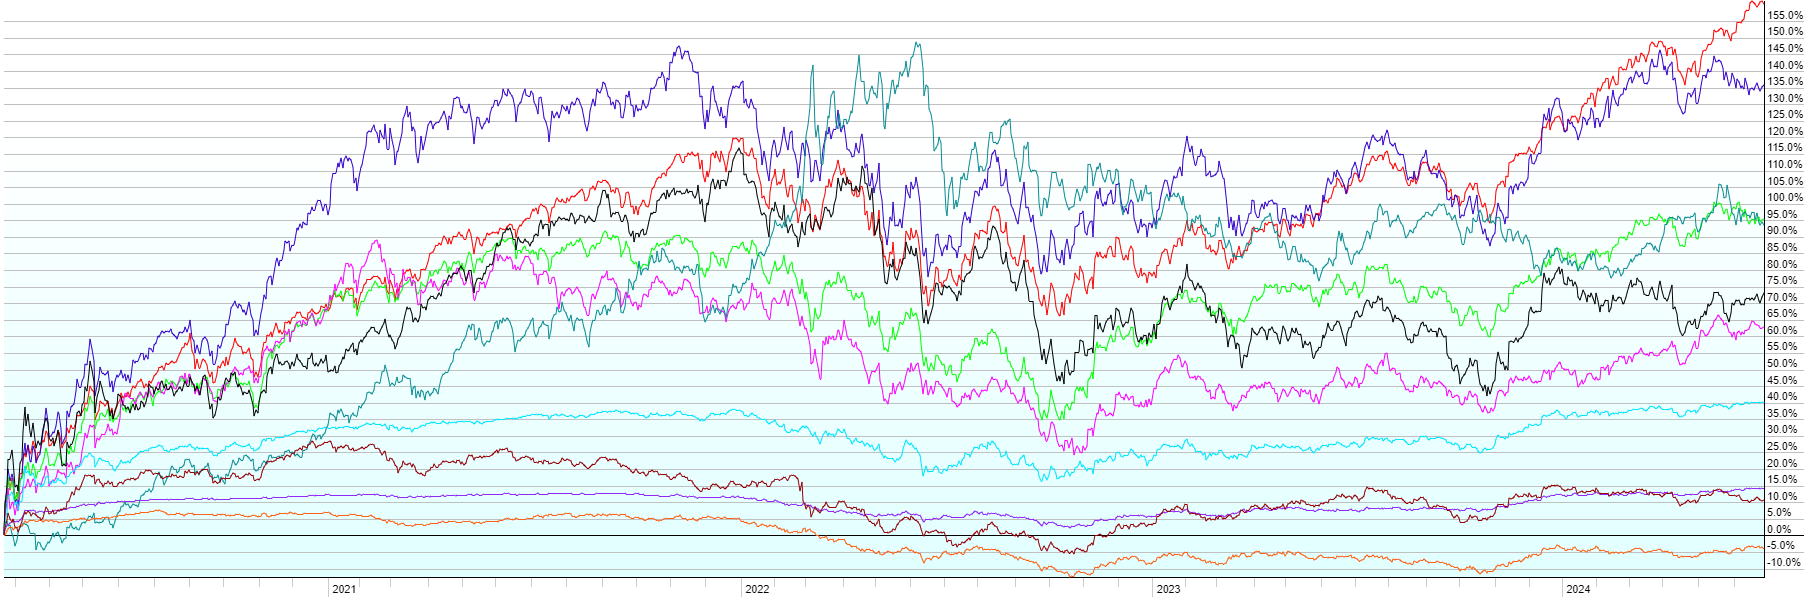
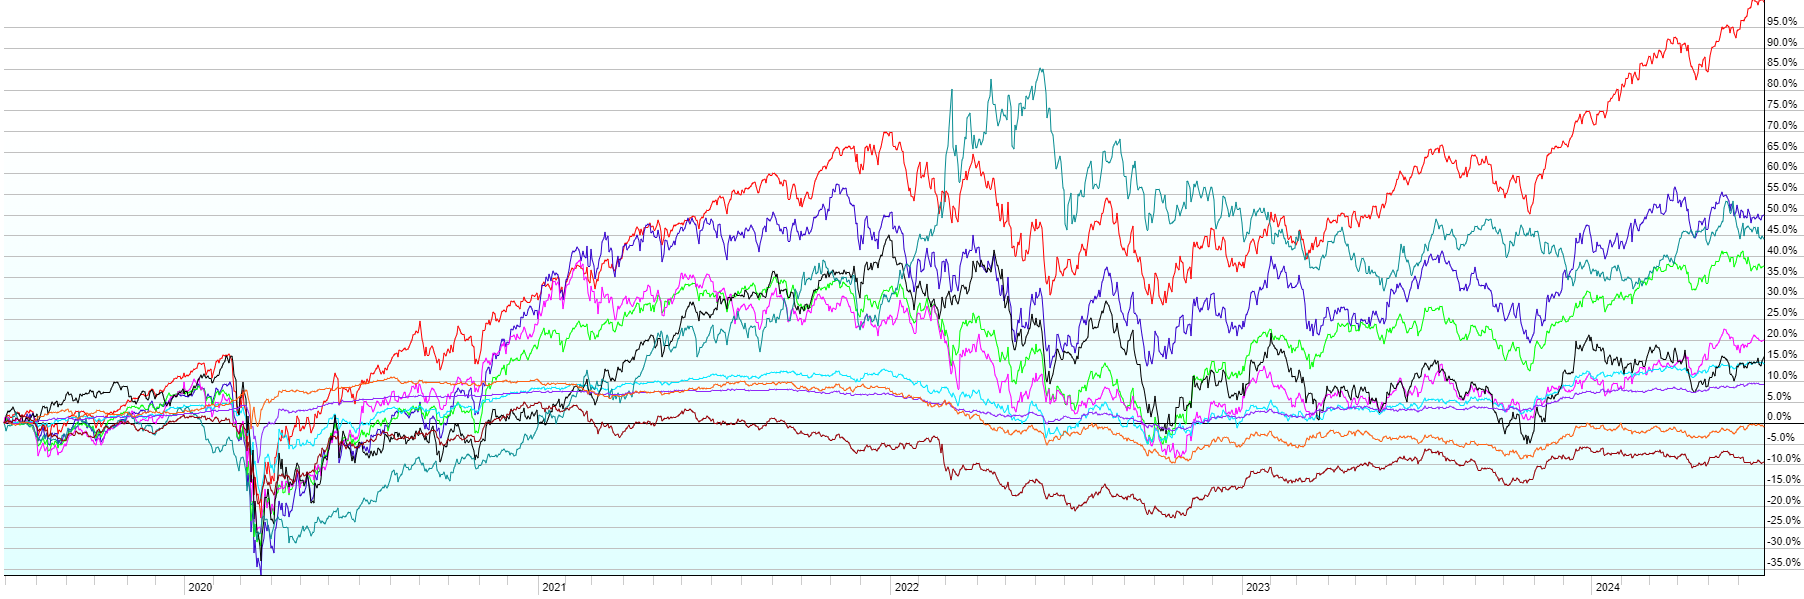
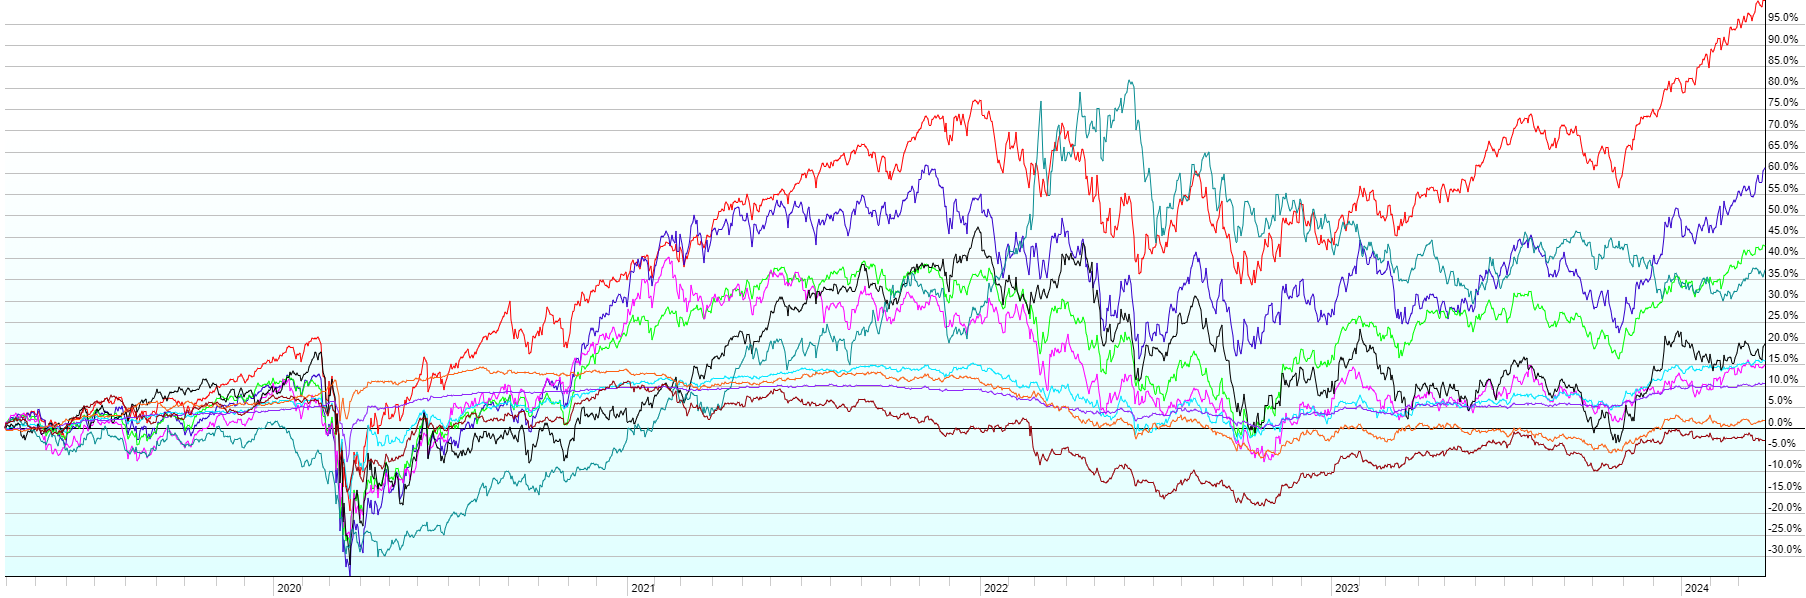
A: The well-publicized S&P 500 was recently at an all-time high, after a year with very high returns in 2019, so 10% down only puts the index back to where it was last fall. But in other areas of the market the impact is worse, even in the US. Small cap stocks still hadn’t exceeded their highs from August 2018, even with the great 2019 year, because of how sharply they were down in Q4 2018. They are now down 14% from their all-time high. Small-cap value stocks are down 21% from their high in Aug 2018. Outside the US, stocks peaked in Jan 2018. Developed markets are down 16%, while emerging markets are down 20% from their all-time highs. Perhaps this correction will finally end the perception that all stocks have been moving straight up since 2009, which was simply not true, even before the covid-19 impact.

Q. Why is this virus having such an impact on stocks?

A. It’s mostly fear of the fear of what’s to come. That is, fear of a sharp economic downturn led by public fear of the virus. If people stop traveling, eating out, shopping, etc., due to worries about catching the virus then those part of the economy grind to a halt. If people can’t work in jobs that require physical presence, then those businesses will be impacted as well. If aggregate demand for products falls, then manufacturing is also impacted. Slowly, a population that is afraid to leave their houses, causes widespread economic distress. That leads to layoffs, less spending, and the usual downward spiral that comes with economic recession. Again, it’s the fear of fear that is causing the stock market to panic and price in lower earnings and an economic downturn. For the most part, it is not that those things are actually happening (at least not to a large degree inside the US). There are also overseas manufacturing issues, predominantly in China where the virus seems to have originated back in December and where 78k of the 82k currently confirmed cases exist. Those manufacturing issues cause inventory dislocations (shortages of some things, too much of other things) which also hurt businesses and can cause product shortages and other supply chain disruptions.

Q. Wouldn’t all of that be temporary though?

A. Likely yes. Though we don’t know how long “temporary” is. Unless the virus is so bad that it kills a significant portion of the world’s population, it’s hard to believe there will be long-term economic impact. But, there is a lot that is unknown about the virus at this point. Even if its death rate isn’t high (currently running at 1.65% outside the China with 55 deaths out of 3,332 confirmed cases), it could become a constant part of society like the flu, which could cause some drop in overall productivity. What makes temporary economic downturns dangerous are the massive debt levels that exist in both the public and private sector around the world. Debt payments continue to be due even if revenue (tax collections for government, sales for businesses, wages for individuals) declines or stops. That risks default or bankruptcy, layoffs, reduction in government services, lower consumer spending, etc. Still, over the long-term aggregate demand would return. While individual businesses may fail, when aggregate demand returns, businesses that survive + new businesses pick up that slack, hire those people who were laid off, and return to growth. Take the airlines for example. Their stocks are getting pummeled by fear of virus impacts. If those impacts are bad enough, it’s possible that debt-ridden companies could have a liquidity or solvency crisis and be forced into bankruptcy or out of business. But the airlines in aggregate, likely have to fly the same number of people from point A to point B once aggregate demand returns. So you’ll have winners and losers, but in total, no long-term impact. That makes massive, industry-wide stock declines seem irrational. Better said, if the long-term outlook for earnings remains unchanged, then even if earnings temporarily fall and a few companies fail, true value of the industry as a whole remains unchanged. On a larger scale, this is why PWA uses extremely diversified portfolios rather than picking individual stocks. We don’t know the future winners or losers (covid-19 didn’t even exist 3 months ago) so we don’t bet on individual companies. Instead we invest in the global economy as a whole, which has a very high probability of growth over the long-term.

Q. Aren’t stock prices already high? Couldn’t this drop just be because prices were overvalued before the virus hit and were just looking for a reason to correct?

A. While some sectors and individual company valuations seem high, the stock market, even at its peak, was not excessively valued in my opinion. To value a stock, you have to look at future earnings and interest rates. With interest rates near historic lows even before the virus impact, stock valuations were fair. The S&P 500 for example was priced at about 18x 2020 projected earnings (which were high given the virus, but again, virus impacts are highly likely to be temporary). That’s a 5.55% earnings yield. In other words, if you put $100 into the S&P 500, its companies in aggregate give back $5.55 of earnings per year. Some of that gets paid out to you in dividends and some of it gets reinvested in the company to produce growth for the future. In contrast, the US 10-yr treasury was yielding ~1.5%, and cash was yielding even less than that. Would you rather have 5.5% per year in something with growth over the long-term (even if comes via a rollercoaster ride of ups and downs) or 1-2% of year steady?

Q. What about the Federal Reserve? What are they likely to do if there is a temporary economic shock due to the virus?

A. The Fed says they’re monitoring and stand ready to act. The market has gone from forecasting a moderate chance of one 0.25% rate cut in 2020, to a likely chance of two and maybe even three. Lower rates help to support the economy, ease debt burdens, provide more borrowing opportunities, and push more people toward investment rather than savings, all of which stimulate the economy. I’ve heard people say that rate cuts can’t cure the virus so they won’t help, but that’s not logical. Rate cuts stimulate economic activity. If the economy is depressed, regardless of the cause, then rates cuts will help offset that depression somewhat.

Q. How bad is this virus?

A. No one knows for sure, and certainly not me. I’m not a doctor or virologist (didn’t even sleep in a Holiday Inn last night), so I’ll stay away from the health impact. We also don’t know the real number of infections, though the reported number is about 82.5k worldwide, mostly in China, but with a rapidly growing number of cases outside China (453 two weeks ago, 1200 cases a week ago, 3332 today). We’re told that the virus has a 10-14 day incubation period, though some people may present sooner after exposure, and that it’s possible people might be contagious even during the incubation period (before symptoms present). If that incubation period is 14 days and the number of cases outside China has increased almost 10x in the last two weeks, it feels like a safe bet that 14 days from now there will be a lot more cases worldwide. In the US, there are currently 60 confirmed cases, with the majority coming from those who have been repatriated from overseas. Your guess on whether the other cases have been contained or not is as good as mine, but in a deeply interconnected world and cases multiplying in places like Europe and Japan, the probability of seeing more cases in the US seems high, whether they come from domestic or foreign exposure. Symptoms reportedly range from virtually nothing, to flu-like symptoms, to much more severe breathing issues and complications due to immune response. I haven’t seen any reporting on what those infections in the US have looked like. We do know that the time to recover varies widely, ranging from a couple of days to several weeks. Maybe the only upside to more cases in the US will be more understanding of the virus actual does, how it works, how it spreads, and how long it takes to get better if you catch it.

Q. Ok, so it’s likely to spread, we don’t know how bad it is, it has killed people, the mere fear of it might cause a recession, and company earnings are likely to take a hit… Are you selling everything?

A. Definitely not. The right answer in this case is to stick to your financial plan. I’ve said numerous times on this blog and in conversations with clients that stocks will almost certainly fall 50% from their highs at some point in our lifetimes (it happed twice from 2000-2009). I’ve also said that we will not know what the cause is or that it’s going to happen, until after it begins. And, we’ll never know when the market is down 10% or 20% whether the correction is over and we’ll get a sharp bounce back up (like in Q4 2018), or if it is just beginning of a 50% downturn (like in early 2008). The ideal strategy is not to try to predict the impact of the unpredictable. It’s to invest in a way that you don’t need to make predictions to be successful in achieving your goals. If you are in a place in your life where you need most of your available money soon (retirement funds if retired, education funds as your children near college age, or liquid funds for whatever reason), then that money shouldn’t be invested all in the stock market. On the flipside, if what happens over the short-term doesn’t matter, then you are far better off ignoring short-term impacts and invest aggressively, in stocks, for the long-term. Both of these are emotionally difficult, but it is how PWA manages portfolios for our clients. If a 10% market correction concerns you, then you’re either invested too aggressively for your goals or you’re letting emotion get in the way of rational thought. PWA is not selling any stocks in client portfolios due to covid-19. On the contrary, we will be selling bonds and buying stocks as the value of stocks fall. We did the opposite as stocks rose and this rebalancing provides a natural buy-low-sell-high rhythm over time.

Q. You always say that unless the world ends, everything will be ok over the long-term. What if this virus is, in some sense, the end of the world?

A. At the risk of waxing too philosophical, we can’t live life preparing for the end of the world. If the world ends and you’re the most prepared for it, do you get anything out of that? Similarly, we can’t invest for the end of the world. He who dies with the most money does not win. Given the infinitesimally small chance that this becomes a cataclysmic event and the fact that your assets won’t have value in a post-cataclysm world anyway, it seems to make a lot more sense to plan for life to continue in its current state for many more generations. Remember also that the intersection of your sphere of concern and your sphere of control is where you should spend your time. Epidemics and doomsday predictions (as well as stock market performance) may be something that worry you, but they are most certainly not things you can influence. If you disagree with this answer, let’s discuss. There are definitely ways to plan for the end of the world, irrational as it may seem. It’s just far from my baseline strategy.

Q. So what should I be doing at the intersection of concern and control?

A.

· Interest rates have fallen pretty sharply. Mortgage rates are at all-time lows. If you own a home and haven’t refinanced recently, check with your lender, another bank, and/or a mortgage broker to see what you can do. Often, taking a slightly above market rate (but still below your current rate) lets your lender give a credit that covers most/all closing costs. That makes the benefit of refinancing happen almost instantly, rather than having to wait for the lower interest payments to offset a high amount of closing costs. Optimizing this is dependent on your individual situation.

· If you’ve been sitting on cash waiting for the market to fall to deploy it to more useful investments than a savings account, here’s a 10% pullback. It doesn’t mean it won’t go to 20% or even 50%. It just means it’s 10% cheaper than a week ago. If you’re not ready to pull the trigger, put a plan in place to pull the trigger based on something certain so you keep emotion out of it (e.g. I will add 20% of my excess cash to my portfolio every 5% down in the market). Don’t get me wrong… having your money always invested is a better mathematical answer, even if it means investing a large lump sum. But if you just cannot get yourself to do that, investing something slowly is better than nothing at all.

· On the flipside, make sure you have an emergency fund of 3-6 months of expenses in cash plus any short-term spending that is needed and won’t be covered by income. People tend to let this slip in the good times because they’re always getting bonuses, commissions, etc. and there’s not need to pay attention to cash levels. Be wary of the not-so-good-times.

· Some temporary economic damage is highly likely. There will almost certainly be job losses. We haven’t lived through that in a decade. Unless you can afford the job loss, make yourself indispensable at work.

· I know I said I’d stay out of the health-related advice, but I can’t resist this one. Stay informed, but from factual sources. Listen to the CDC. (You can also find infection statistics, updated daily, from John Hopkins CSSE). Wash your hands. Try not to touch your face. Be wary of misinformation or fear mongering from those who profit by keeping your attention (i.e. anyone who sells ads). And, I hate to say this, but It’s an election year and while we hope our leaders put politics aside, their careers depend on your feelings. Incumbents have a bias toward making the situation seem better than it is. Challengers have an bias toward making the situation seem worse than it is. Keep that in mind and try to listen to more than one source of information before reacting to anything.

Market Update – Part Two, “The Why” – What’s Causing Market Angst

This is part two of a two-part post on recent market declines. Part one contained what I call “The What”, defining the declines and trying to give some historical perspective. Part two contains “The Why” by trying to summarize, in layman’s terms, what is causing the market angst at the moment and what to do about it.

Trying to understand the stock market is like trying to understand a baby. Everything tends to be perfectly fine until suddenly, it’s not. Even when you can pinpoint the immediate cause of a meltdown, it’s often underlying issues that have been building (tired, hungry, getting sick… in the case of the baby) that are the root cause of the meltdown. There is little to no communication about the why… you just know it’s not good. I’m going to give you my opinion on what has caused the stock market to act like a baby over the past couple of months. Like the baby, the stock market hasn’t told me precisely what’s wrong… I just pay close attention to things that could be root causes so I know what’s going on when a triggering event occurs and causes a meltdown. While we can’t do anything about the meltdown, and we know it’s not abnormal (see Part one of this post), it’s reassuring to know the potential causes. I see six of these, with the last two being the most important:

1) Rising interest rates – the Federal Reserve has been raising the overnight lending rate by 25 basis points per quarter for about two years. It now targets 2-2.25% with markets expecting another quarter-point hike later this month. 2.5% is historically low and the Fed still considers it to be stimulative to growth. However, after nearly a decade of ZIRP (zero interest-rate policy) there is an anchoring effect that must be considered. Suddenly, investors can earn 2% (which is still just barely the rate of inflation) in a savings account or 3-4% in a fairly safe bond fund and it feels like a huge win vs. a decade of zero. On the margin, more may be choosing conservative investments over stocks. Mortgage rates climbing back to near 5% (historically very low) suddenly makes home purchases a lot more expensive when everyone was used to paying 3.5%. We’re seeing home sales decline and price increases halt as a result. Corporations borrowed massive amounts of money at low rates over the past decade and used it to invest in growth, pay dividends, and buy back stock. As those loans become due, where will the money come from to pay it all back? New loans at higher rates? That’s going to hurt the income statement. Secondary equity offerings? Not good for the stock. Then there’s the massive debt that governments, including ours, have taken on. At low rates, that debt is affordable. But as rates rise, the interest payments start to swamp the tax collections (especially after “mandatory spending”). This is how debt spirals to a point where it can’t be paid back. If the Fed stays on its current course to return rates to historically normal levels before the economy can anchor to non-zero levels, it will act as an economic shock and stop growth in its tracks. Last week, Fed chief Jay Powell indicated that the Fed isn’t on a pre-determined course, is close to “neutral”, and will be data dependent. This eased some market concerns, but a Fed policy mistake is still a big market risk.

2) Global trade issues – I think this one is pretty easy to understand. If the US and China are entering a long, drawn-out trade war with tariffs and other impediments to global trade issued on both sides, then there will ultimately be less global trade. Less trade means less growth and less growth means corporations make less money (or grow more slowly) while debt issues are exacerbated. Tariffs as negotiating weapons are ok to the market, especially for long-term gains like protection of intellectual property across borders. Tariffs as the end game will not be ok with the stock market. Every time it looks like there’s a path to easing of tensions, markets rally. Every time tensions increase, markets fall. Lack of communication as to the plan and inconsistent messages cast doubt on ultimate resolution. The stock market is only going to put up with that for so long before pricing in a higher probability of an extended trade war.

3) Strengthening US Dollar – the dollar has been on the rise vs. most other currencies as the US has been doing better economically than most other countries. As the dollar strengthens, US exports seem more expensive to foreign consumers, hurting US demand. US multi-national corporations lose on currency exchange when repatriating foreign profits (weak currency) into US dollars at home (strong currency), thereby hurting profits. Foreign debt issued in US Dollars becomes bigger to the foreign country that owes the money. This weakens the foreign currency further and can spiral into a currency crisis. All of these things are bad for US stocks.

4) European Union Issues – I’ll lump Brexit and the overall fiscal fiasco of the EU into one major issue. If a Brexit deal can’t be reached with the EU and there is a “hard Brexit”, Great Brittan and the European Union essentially stop doing business with each other, resulting in massive job losses and other economic dislocations. The possibility of that happening has ramped up recently as deadlines approach. In the rest of the EU, budget issues continue to challenge the southern countries who need ongoing support from Germany and the wealthier, less debt-riddled countries. The threat of Italy losing its borrowing lifeline, potentially ditching the Euro, and maybe setting off a chain reaction with other countries doing the same is like the Greek issues of a few years ago times 100. It’s becoming more and more apparent that the European Union experiment, in its current form, has failed and it’s now just a matter of stretching out the unraveling for a long enough period so that it can be creatively redesigned or unwound in the least shocking way possible. If Europe can fix itself over the next decade, even if it involves some up-front pain, that would be a massive lift for the global economy. If it can’t and there is a financial shock as a result of unraveling, it certainly won’t be good for stocks.

5) Too much government debt – the world simply has taken on too much debt over time. Governments have promised too much to their people in return for votes (low taxes, high spending). Either defaults are going to happen or inflation is going to spike, thereby making those fixed rate debts seem smaller in future dollars. Either one is going to hurt. The more time that passes with already bloated debts growing faster than the economies they rely on, while interest rates rise, the closer the world gets to a point of no return. We don’t know where that point is, when the debt markets will turn on borrowers that can’t repay, or if / when governments would start the inflationary printing presses to avoid default. This risk moves in slow motion but is probably the biggest one for the long-term.

6) The self-fulfilling prophesy – we’re pretty far from this happening in my opinion, but this is the biggest short-term risk. If the stock market volatility goes on for too long or if the market falls too far, then consumer and business confidence will wane. Our economy is built on confidence. If companies stop hiring, expanding, and investing, and/or consumers stop spending, recession is right around the corner. Similarly, you may have heard about the inverting yield curve lately. Generally, long-term interest rates are higher than short-term rates (positive, upward sloping yield curve if you plot rates on the y-axis and term on the x-axis of a graph). This positive yield curve is an indicator of expected future growth. Lately, short-term rates (specifically the two-year treasury) have been approaching long-term rates (specifically the 10-year treasury). That 2-10 spread is closely watched as an indicator of future growth and it’s dangerously close to inverting. The last several times that happened after a period of normal rates, a recession has been on the horizon. Higher short-term rates than long-term rates are deadly for banks who borrow short (pay on deposits) and lend long (loans and mortgages). If banks can’t make money on that spread (“net interest margin”, their profits dry up and they may wind up with less money to lend or be unwilling to lend. Less lending can impact the ability for businesses and consumers to borrow, potentially leading to recession. This means that an inverted yield curve that predicts recession could actually lead to it… another self-fulfilling prophecy. Keep in mind though that even if recession happens, the typical one is a pause that refreshes, that brings valuations back in line, that scares off the weak hands, that kills the companies that took on too much leverage, that leads to the birth of the next growth cycle. A recession in a world with too much debt though could intensify and accelerate the debt issues described in #5.

Here’s the good news… when there are reasons for concern in the stock market, the eventual elimination of those concerns often leads to new growth. This is frequently called “climbing the wall of worry”. When the worries are all gone and everything is perfect, then perfection is priced into the market and there’s often no more room for prices to increase. No more wall of worry means nothing to climb. So, it’s highly possible that these worries will provide the legs for the next bull market to stand on. I have to admit, when the tax cuts went through, unemployment dropped near 4%, corporate profit margins hit all-time highs, inflation remained low despite low interest rates, I started to worry that there wasn’t much to worry about. Now there’s a real wall of worry to potentially climb.

If you’ve read this far, I know what you’re probably thinking… This is all well and good and thanks for explaining all that but… is this an opportunity to buy cheap, or a last chance opportunity to get out before a big fall? No one ever knows that answer in advance. What we do know for certain is that there are going to be big falls at some points in the future. I tell clients to expect a 50% decline in stocks at some point in life (we had two of them in one decade in the 2000’s). This of course doesn’t mean your portfolio will fall 50% because not all of your money is in stocks. Young clients with decades until retirement and only a small percentage of what they’ll ultimately need to retire have retirement money primarily invested in stocks. But, they actually benefit from a decline in prices because they have much more to contribute to their retirement portfolios (at lower prices if prices fall) than would be lost from a temporary decline in the value of existing assets. On the other extreme, clients who are well into retirement, or those with shorter-term goals where money is needed over the next few years, are not primarily invested in stocks. A portfolio that is 30% stocks / 70% bonds will experience about a 15% loss if the stock market falls 50% (generally less than 15% because bonds tend to do well when stocks fall dramatically). It’s essential to get the mix right, but once you do, it doesn’t matter what happens with stocks over the short-term. You’re either in stocks for the long-term or you’re not primarily in stocks.

We know declines will happen. We just don’t know when they’re going to happen. When you invest, you accept that stocks are going to fall, and create a plan that works despite the stock market’s short-term swings. If a stock market decline scares you off your plan, you’re doing yourself an injustice by allowing that to happen. As I pointed out in Part one of this update, stocks are down at least 5% from recent highs almost half the time. So, should you buy, or should you sell? If your plan calls for adding money to your portfolio to target a future goal and you have free cash flow to do that, then add money (buy). If your plan calls for liquidation to support retirement expenses or to buy that next house, then withdraw money (sell). React to life events, not stock market events. Avoid the temptation to put your emergency fund in stocks during the good times or to pull your retirement money out of stocks in the bad times. In the meantime, we will be using the volatility, where appropriate, to rebalance portfolios back to target (sell what’s up, buy what’s down) and tax-loss harvest (sell securities with unrealized losses and repurchase similar securities to unlock the loss for tax purposes). Volatility fees bad, but without it, stocks would be risk-free. If they were risk-free, they’d be paying 2% like savings accounts. The risk has to be there in order to justify the long-term returns. I will continue to remind you that when the market is smiling, a tantrum is around the corner. When the market is throwing a tantrum, happier times and then more tantrums are ahead. It is the nature of being a parent… er umm… an investor 🙂

What The Fed Rate Hike Means For You

In a widely expected move, the Federal Reserve raised the Fed Funds target rate range from 0-0.25% to 0.25-0.50% earlier today. They forecast a gradual (though not set in stone) increase in that rate by about 1% per year until reaching a terminal rate near 3.5% in 2018. This marks the end of seven years of ZIRP (Zero Interest Rate Policy) and is the first rate hike in nine years. I wanted to take a minute to clarify how this move is likely to impact you. There is a perception that the Federal Reserve controls nearly all rates on all financial products, which is not the case. Below is a non-exhaustive list of what will likely be impacted immediately and over the longer term. As always, if you have questions about something that is or is not covered below, please don’t hesitate to ask.

· Interest Paid By Your Bank On Your Savings – Likely no impact at all in the short-term. The average checking account will still pay approximately 0.00%. The average savings account will still pay approximately 0.05%. Online savings banks, some credit unions, some local banks, etc. will continue to pay in the 0.5-0.9% range. It is very unlikely that the big banks (BoA, Wells, JPMorganChase, etc.) will raise their rates on savings as a result of the Fed hike. Once the Fed Funds rate gets to 0.75%-1.00%, we’re likely to see the big banks begin to pay more in interest and move rates up slightly less than 0.25% with every 0.25% hike by the Fed. While the banks get paid more on their reserves, they won’t really have an incentive to pass that along to the consumer until rates are a bit higher and they start competing over customers. This is akin to when oil prices come down suddenly, but prices at the gasoline pump move down much more slowly over an extended amount of time.

· 15 & 30 Year Fixed Mortgage Rates – Likely little impact in the short-term. Mortgage rates are tied to longer-term rates than the Fed Funds rate (which is an overnight lending rate). Long-Term rates are much more tied to the economy, the supply of and demand for money, competition with long-term rates in other countries, and expected long-term inflation than they are to the short-term rates that are controlled by the Fed. The Fed will move short-term rates up as the economy improves, so in a sense, long-term rates should come along for the ride over time as economic growth leads to higher inflation expectations and higher demand for money. In reality though, increasing short-term rates tends to put a brake on economic growth and given the extreme policies in Europe and Japan that are geared toward keeping long-term rates down in those countries, it’s unlikely that US long-term rates can move up very far very fast.

· Variable Loan Rates (mortgages & other) – Likely to move up in lock-step with the increase in Fed Funds. Most variable rate loans are tied to the PRIME rate (generally 3% above the Fed Funds rate and controlled by banks) or to 1-month, 3-month, or 1-year LIBOR (another short-term lending rate that is very closely tied to the Fed Funds rate plus a premium for credit conditions). The big banks increased their PRIME rate to 3.5% shortly after the Fed’s announcement today. LIBOR has been floating up in expectation of the Fed announcement. As an example, if you have a Home Equity Line Of Credit (HELOC) with a rate that is PRIME + 0.5%, you’ve been paying 3.75% interest on that loan for the past 7 years. As of today, that rate is now 4%. By the end of 2016 it is likely to be 5% and by 2018 it is likely to be 7% if Fed projections are correct. If you have a variable rate primary mortgage that is 1-year LIBOR + 2.75% rounded up to the nearest 1/8th of a percent, that rate was 3.375% a year ago and today it’s 3.875%. It would likely be ~5% by end of 2016 and ~7% by end of 2018 if Fed projections are correct. You can expect a point-for-point increase in the rate of loans tied to PRIME and a close to point-for-point increase in loans tied to LIBOR. LIBOR loans could also see additional increases if credit tightens (like it did in the extreme case in 2008/09 after Lehman Brothers failed and no one trusted lending money to anyone else for a while).

· Economic Growth – There is a school of thought that believes that ZIRP was hurting economic growth and causing dislocations through the financial system. The more traditional economic view is that the lower the Fed Funds rate, the more stimulative it is for growth. I personally believe that low rates are stimulative in that they encourage more borrowing, more lending, more spending, more investing, and less saving (cash sitting around doing nothing). However, the longer rates stay low, the more they push investors into riskier investments in seeking higher yields. This applies both to financial institutions (a SF Credit Union offered a $3M mortgage with no downpayment required last week, for example), and to individual investors putting money in high-yield investments without considering the risk (see this article from Bloomberg about a recent high-yield bond mutual fund that recently told investors they couldn’t sell and get their money back). Eventually, excessive risk-taking leads to a bubble which inevitably leads to a crash. So, in a sense, the Fed’s rate increase and guidance that they will continue to normalize rates helps to avert a growing bubble/crash scenario. Fear subsiding can lead to higher economic growth. Whether that is enough to offset the negative growth impact in reduced lending, borrowing, investing, and spending remains to be seen. A 0.5% Fed Funds rate and $4 Trillion Fed balance sheet are extremely stimulative. But with each increase in rates, and with each reduction in the size of that balance sheet (which will start eventually), they become a bit less stimulative. Economists generally believe that the level of rates and size of the balance sheet are more meaningful than the direction of movement in those rates and the balance sheet. The aggregate psychology of the financial markets seems to put more weight in the direction of movement. I suspect that short-term, the markets will have their way and price in a slowdown in growth, some of which has already started. The Fed’s challenge is that if markets believe higher rates will cause a recession, that belief alone can cause the recession as businesses pull back investment, consumers slow their spending, layoffs start, etc. It remains to be seen whether the Fed can maintain confidence via a very slow trajectory of rate hikes, in which case they’ll be able to normalize rates over time while continuing to let low rates stimulate growth during the rate hike cycle.

· Inflation – Inflation is currently running near zero year over year, mostly due to the impact of the sharp decline in commodity prices. This has run counter to everything in economics textbooks. Central banks all over the world have been printing money to try to stimulate growth and avoid deflation. Even with trillions more dollars, euros, and yen in the system, the aggregate price of goods is not rising. The Fed believes the impact of energy is “transitory” in that lower energy prices tend to feed through the economy short-term and hold inflation down, but over the long-term lower energy prices provide an engine for growth. They believe inflation will get back to their target, which is 2% per year, over the next few years. They say they’re increasing interest rates starting now so that they can do it in a gradual manner rather than waiting until inflation picks up which would cause them to move more aggressively with rate hikes to fend off a hyperinflation scenario (which has caused recessions in the past). Again, it remains to be seen whether they’ll be successful or not.

· US Dollar Relative To Foreign Currencies – The dollar has been on a big run relative to other currencies since mid-2014. Money usually chases higher rates and safety (which rarely go hand-in-hand). In this case, the US looks safer than virtually any other country (some plagued by political instability, others by a banking crisis, others by fiscal issues), and it had the prospects of increasing rates over time while other major parts of the world are decreasing rates and/or printing money to fend off recession. Higher US interest rates are widely expected to continue to increase the dollar’s value relative to other currencies. At some point though (and maybe it’s here), a higher dollar starts to impact US exports substantially, starts to push more work offshore where labor is cheaper, and starts to make foreign investments look cheap in dollar terms while US investments look expensive in foreign currency terms. All of those things can put a dent in US growth and cause interest rates (and therefore the dollar) to come down. There’s no way to know what’s going to happen, but it definitely feels like the dollar is getting very expensive and foreign currencies (particularly those of emerging markets) are getting very cheap. One thing is certain… if you live in the US, are paid in US dollars, and like to travel the globe, it’s a LOT cheaper to do it today than it was a couple of years ago.