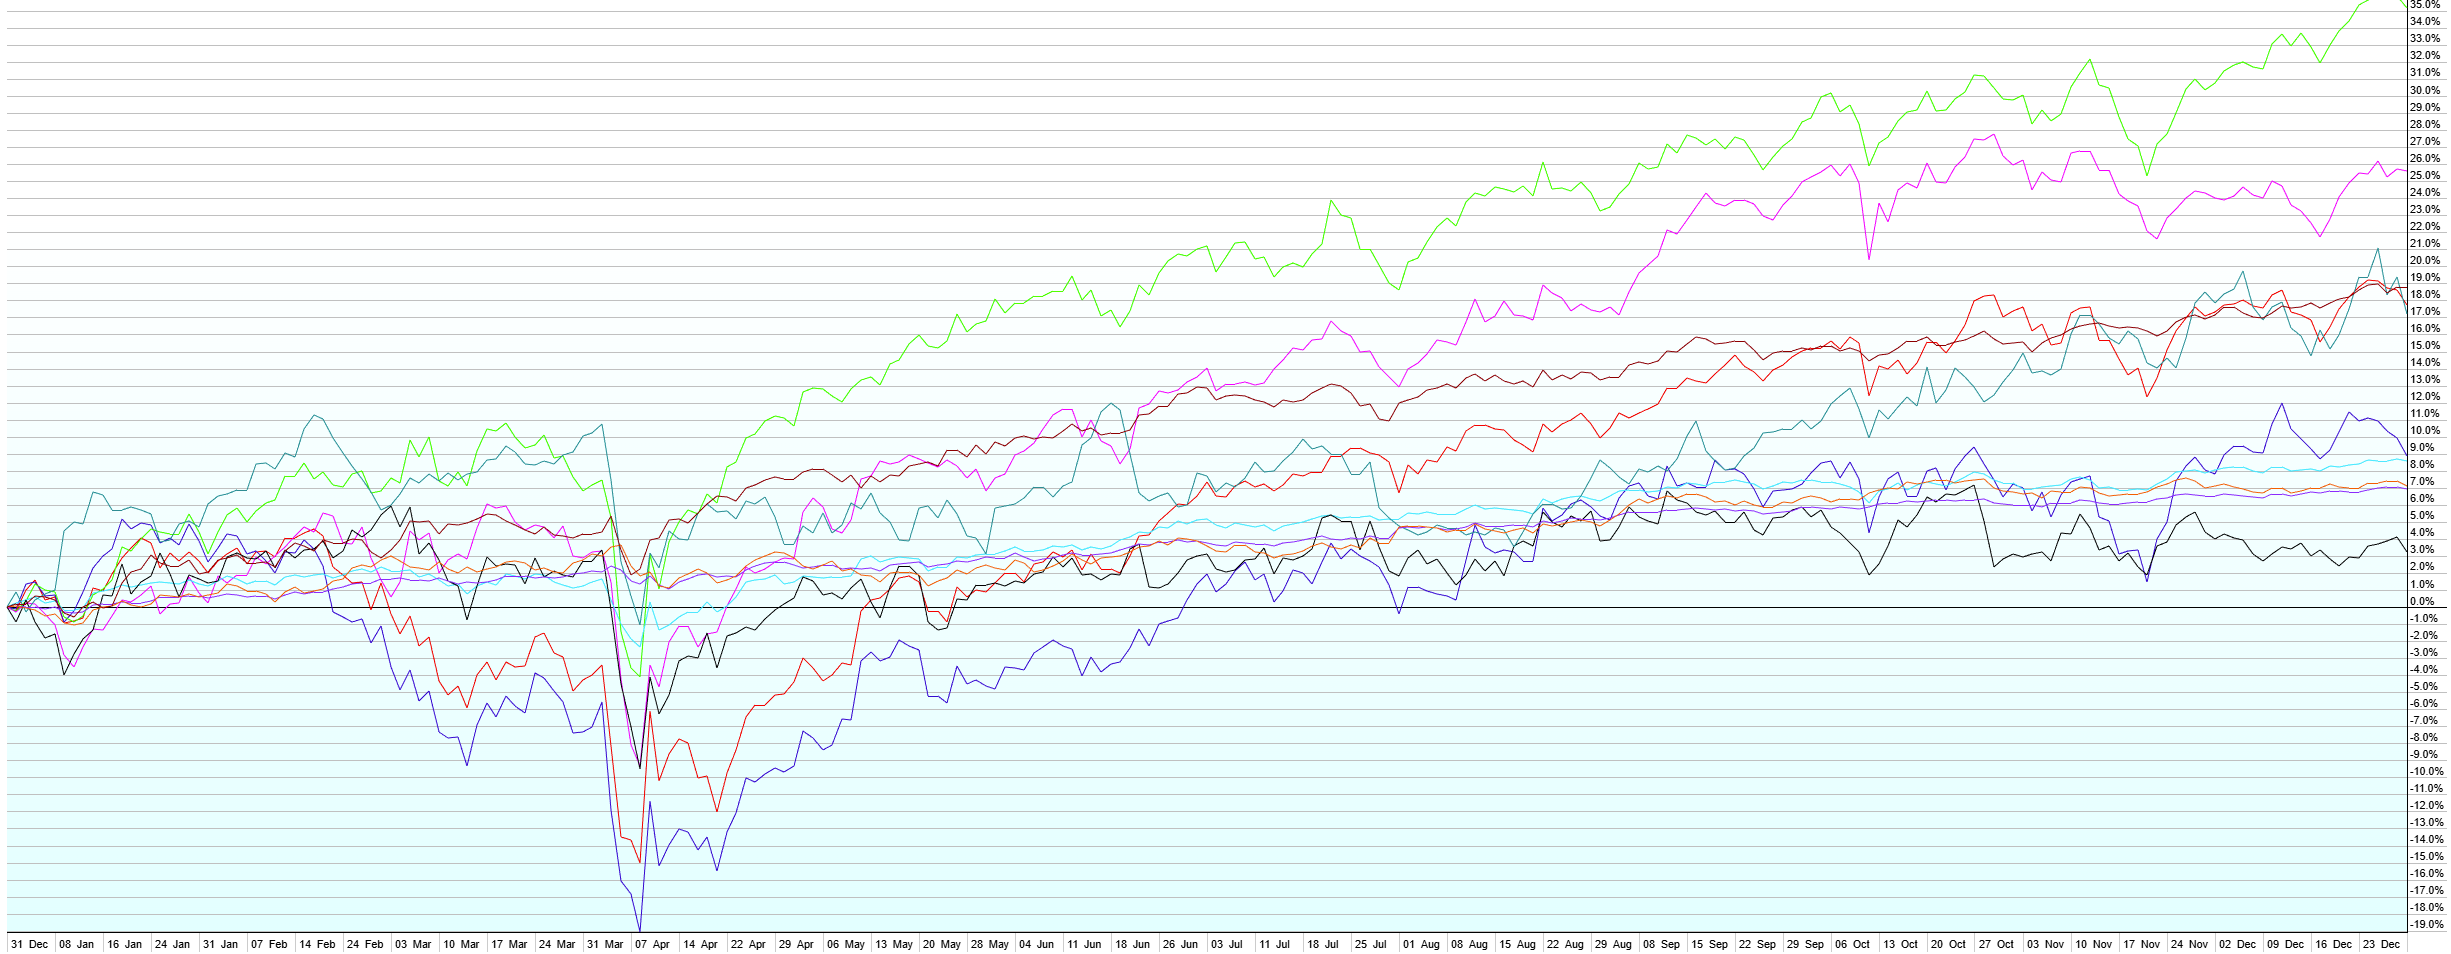
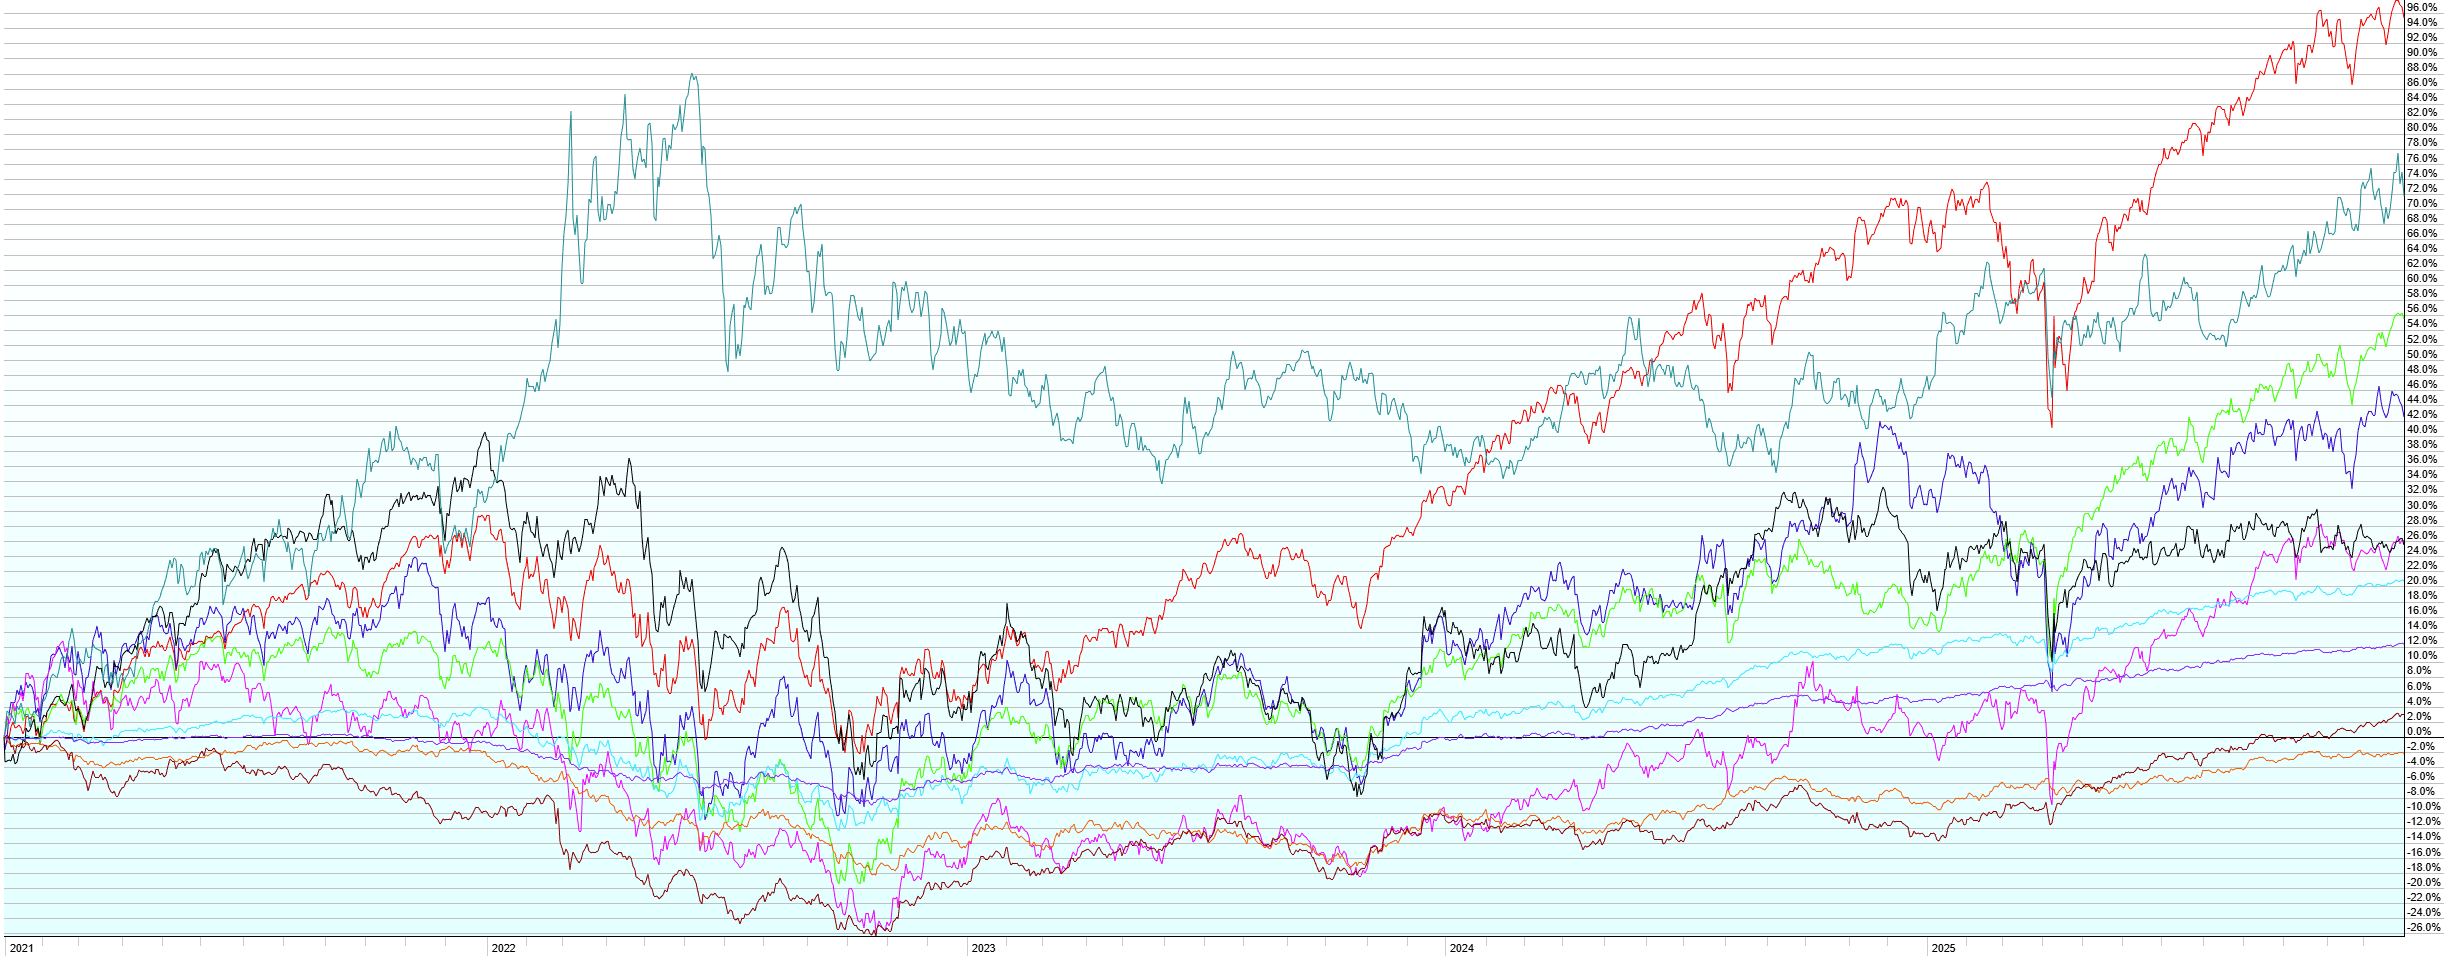
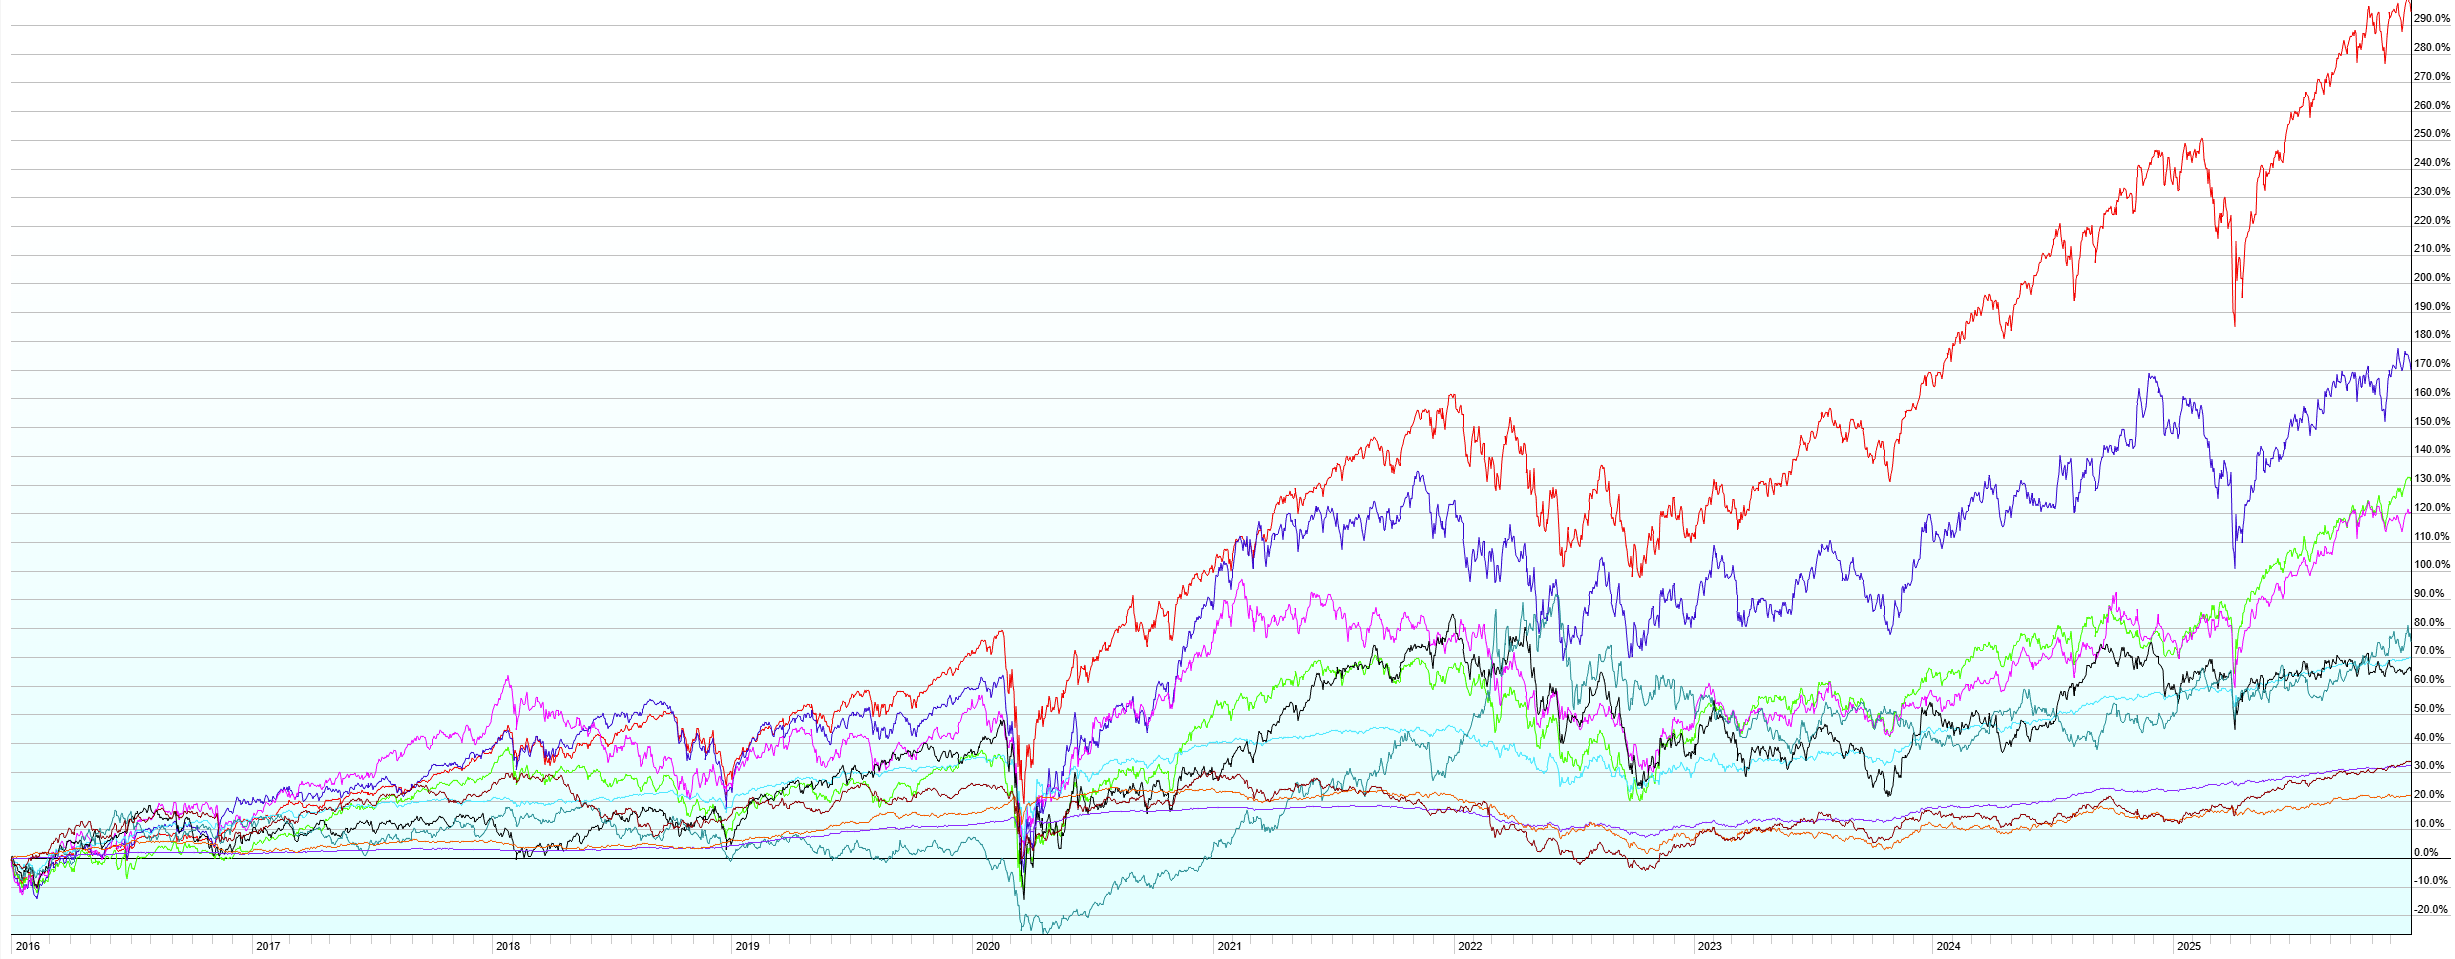
This post contains the usual returns by asset class for this past quarter (by representative ETF), last 12 months, last five years, and last ten years. While there is still no predictive power in this data, I’ll continue to post this quarterly for those of you that are interested.

A few notes:
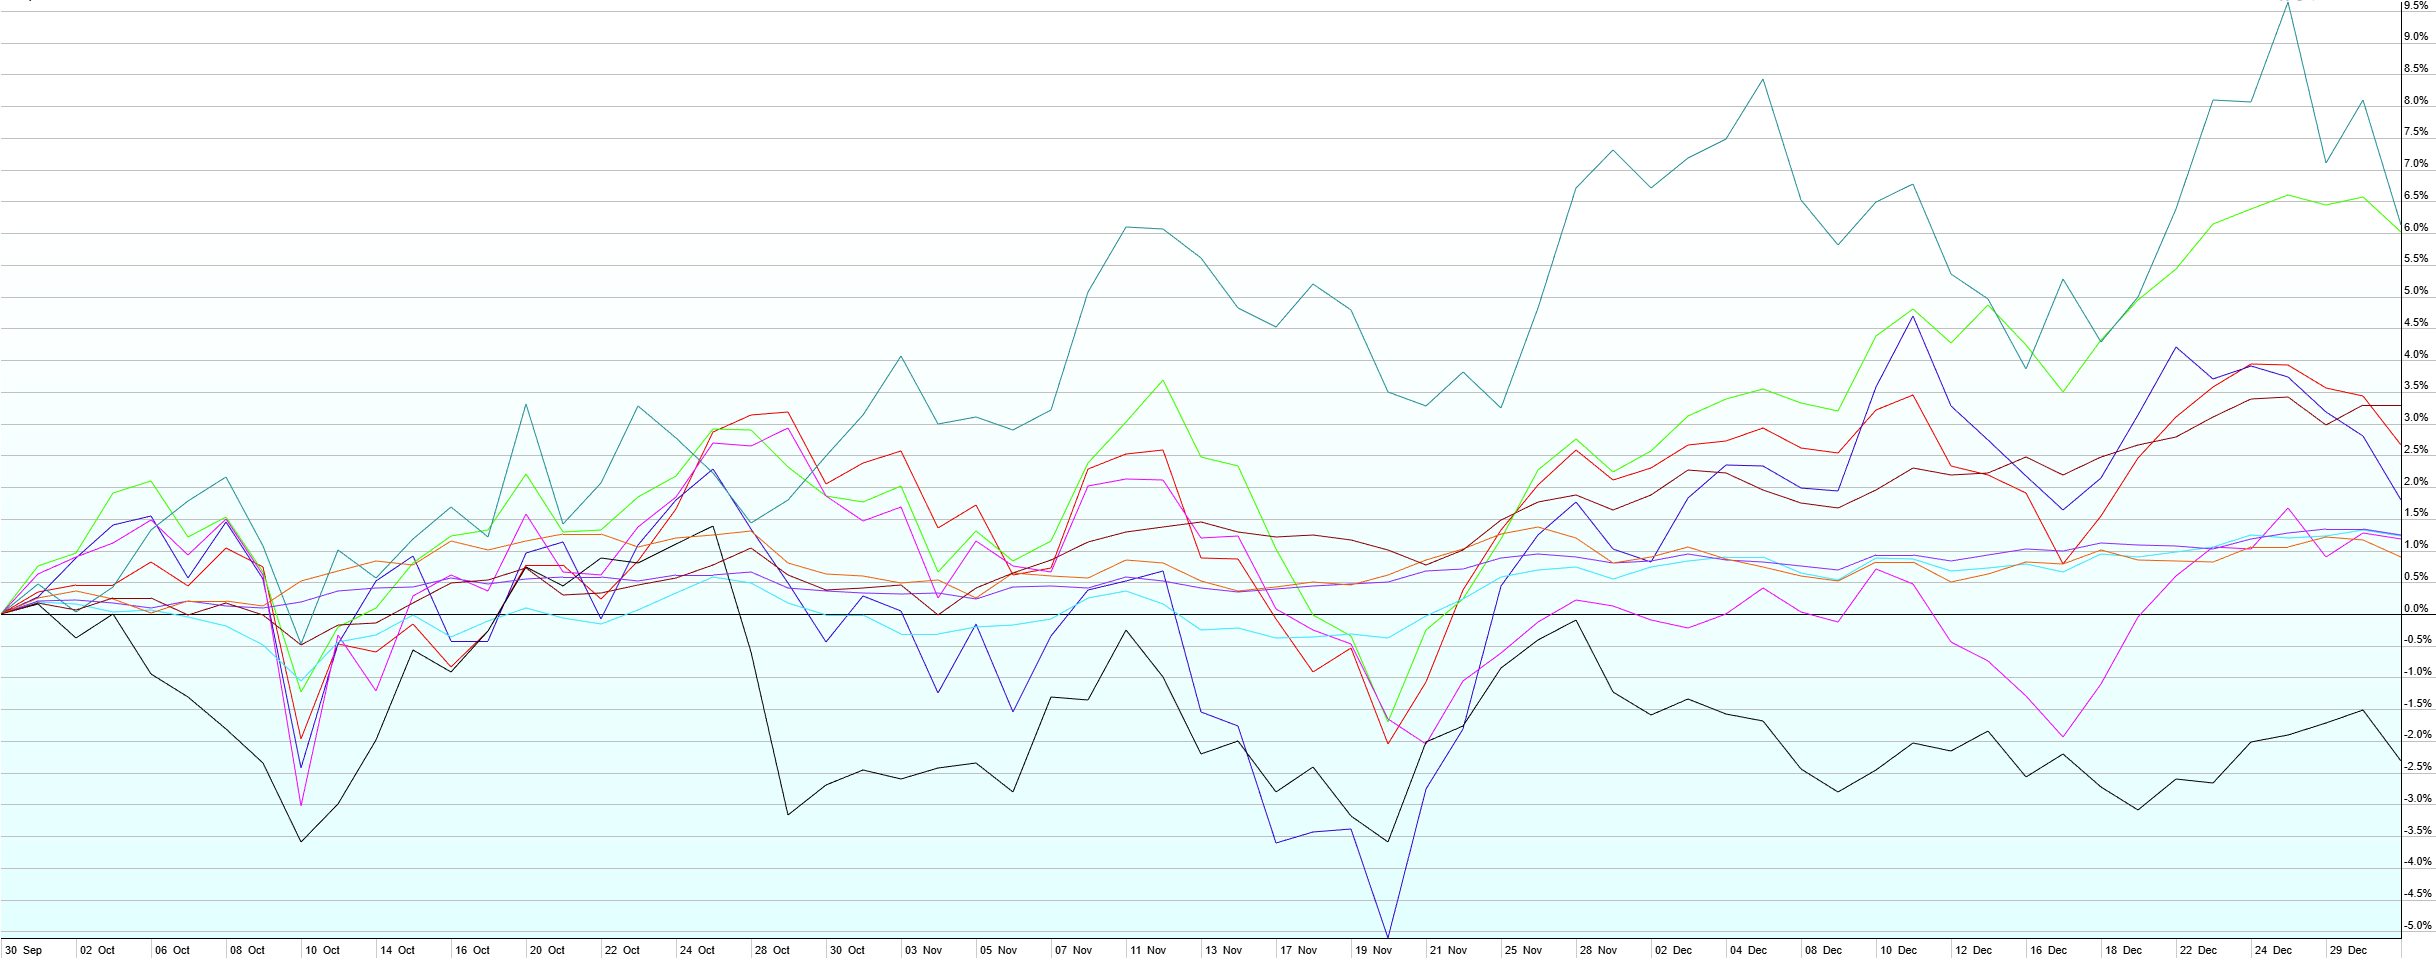
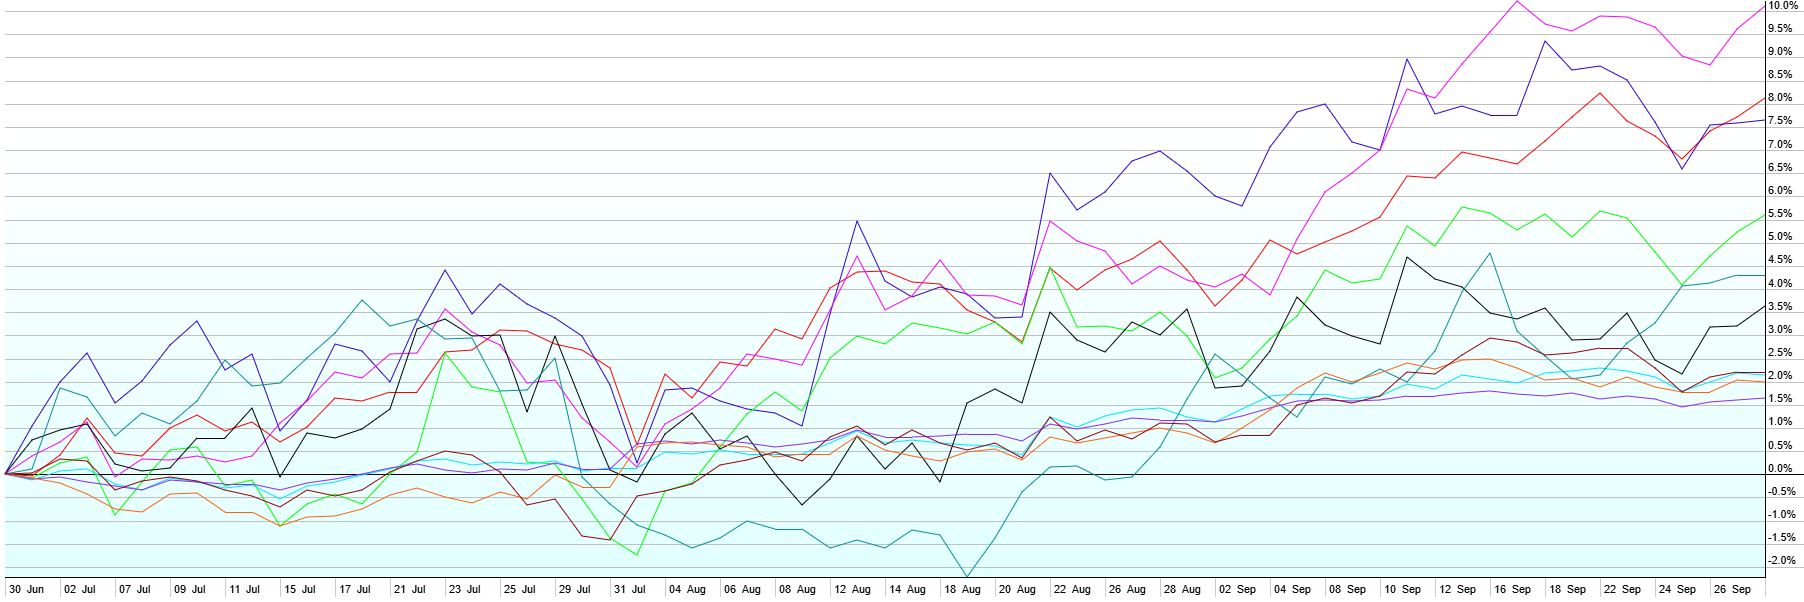
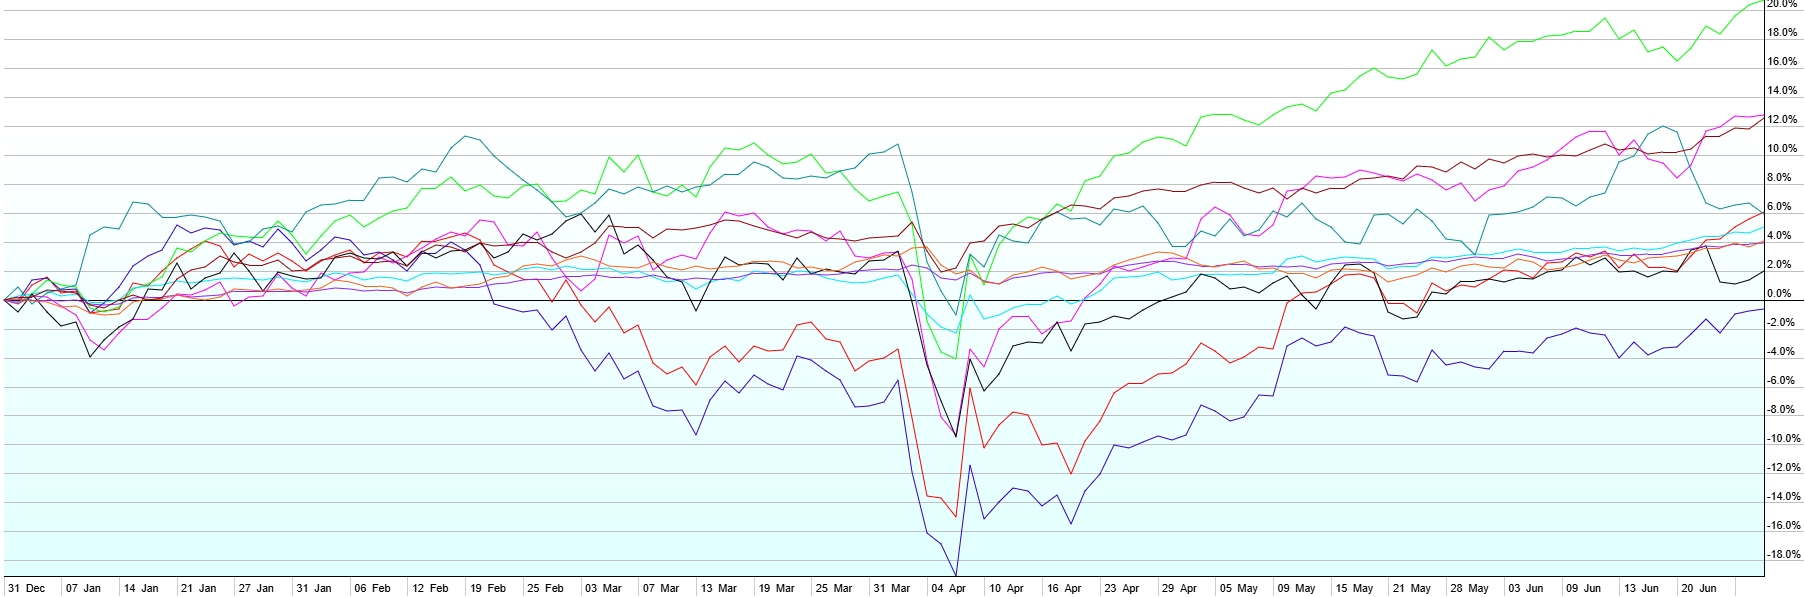
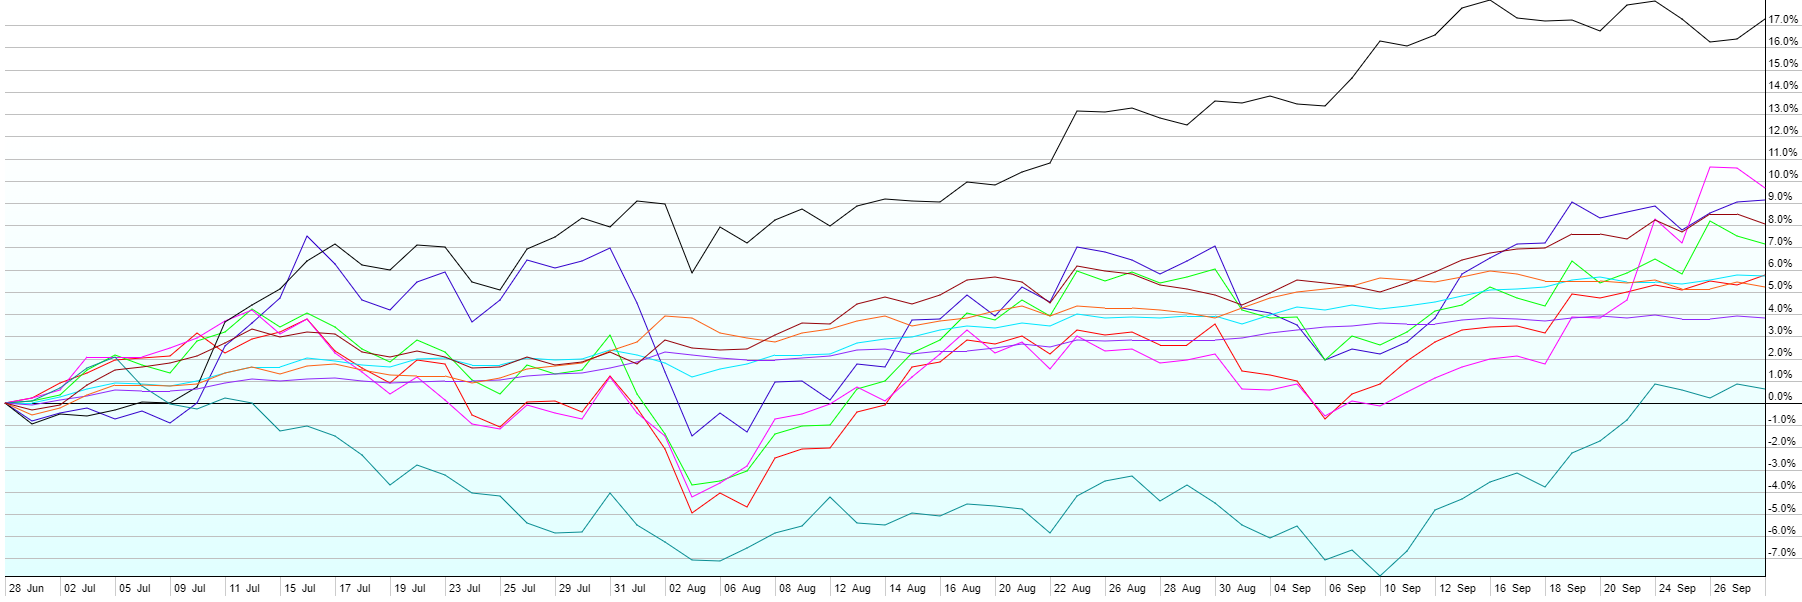
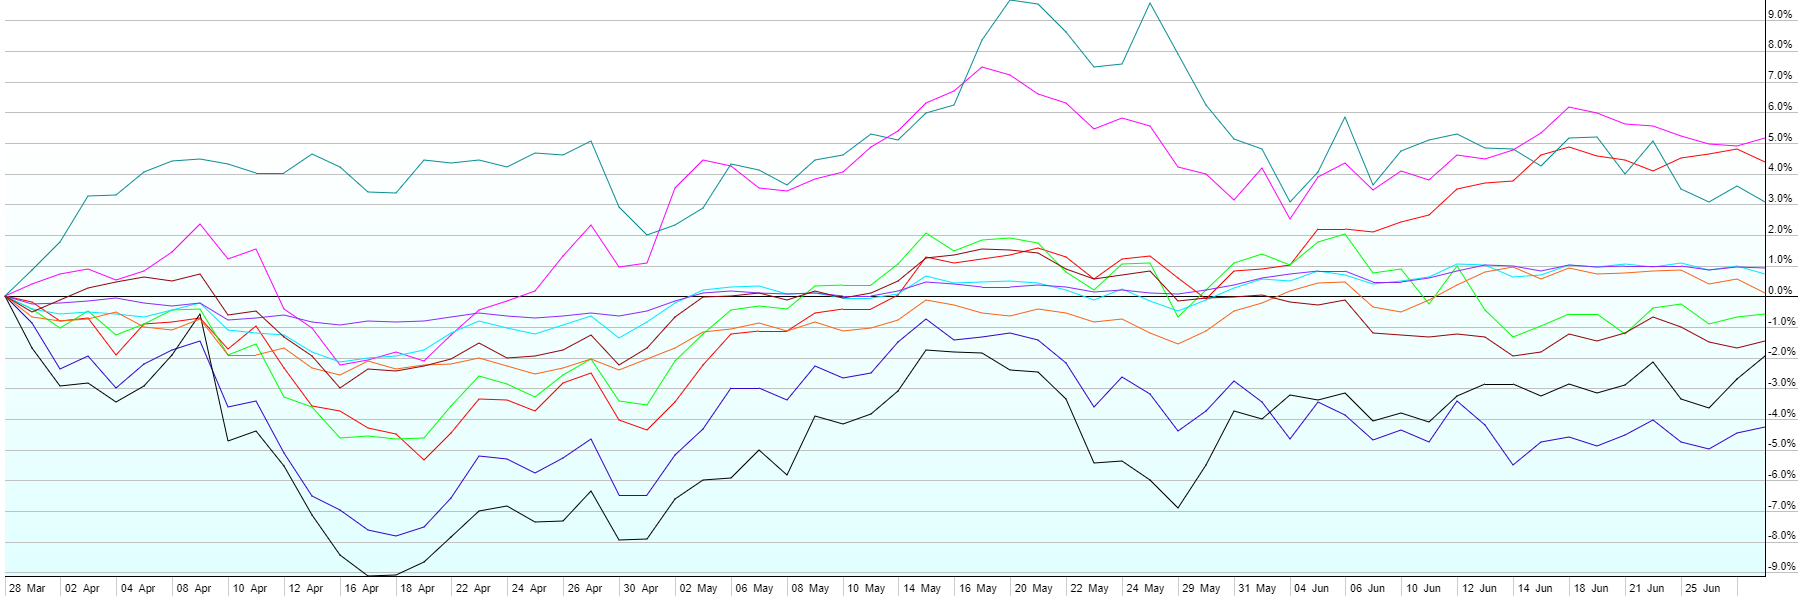
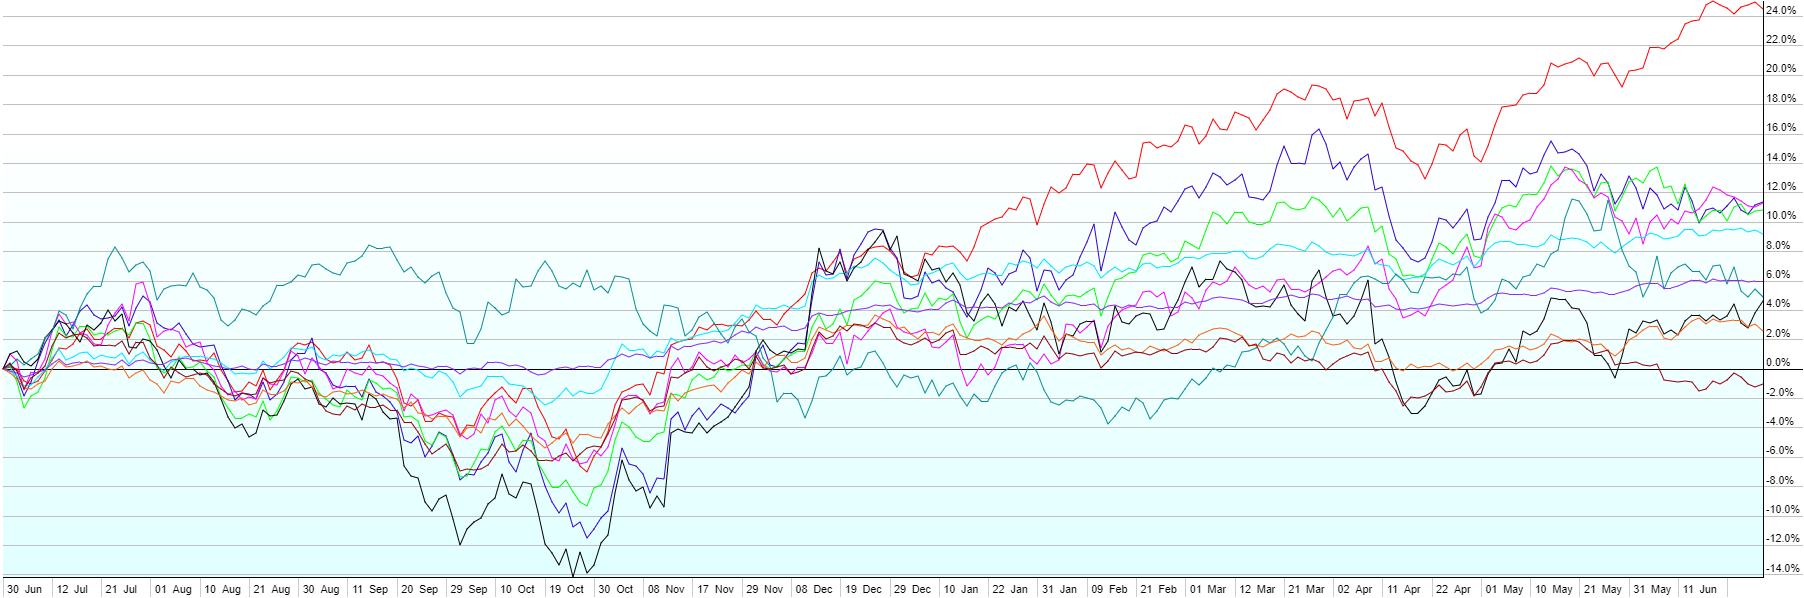
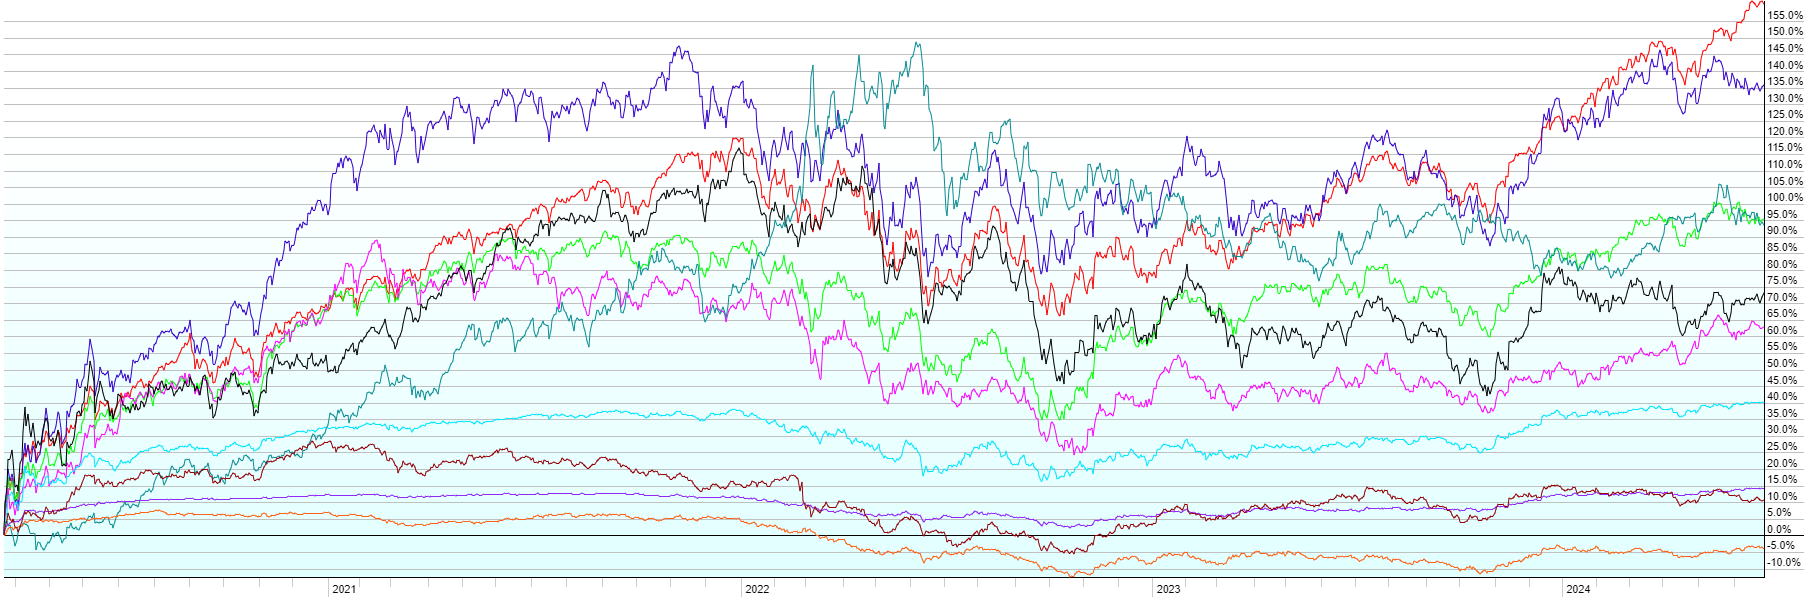
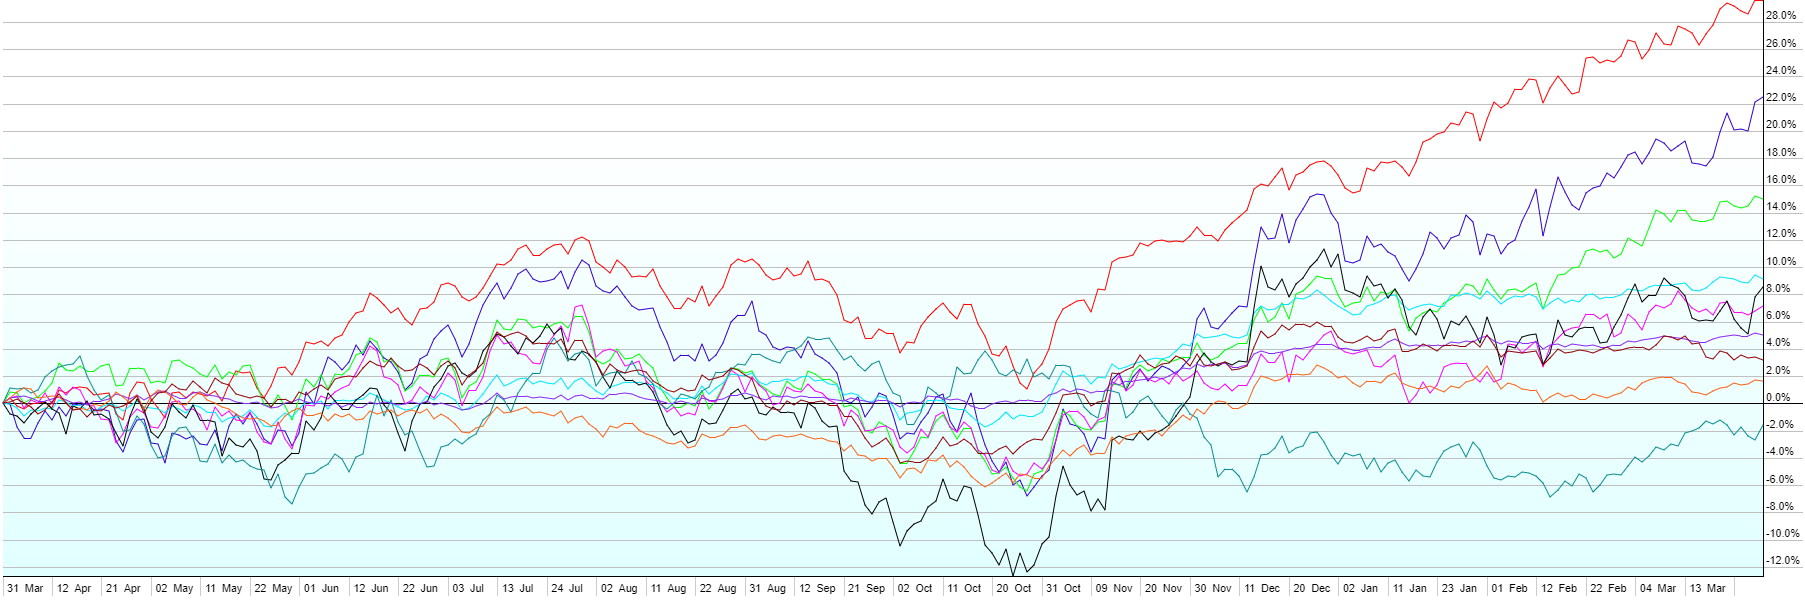
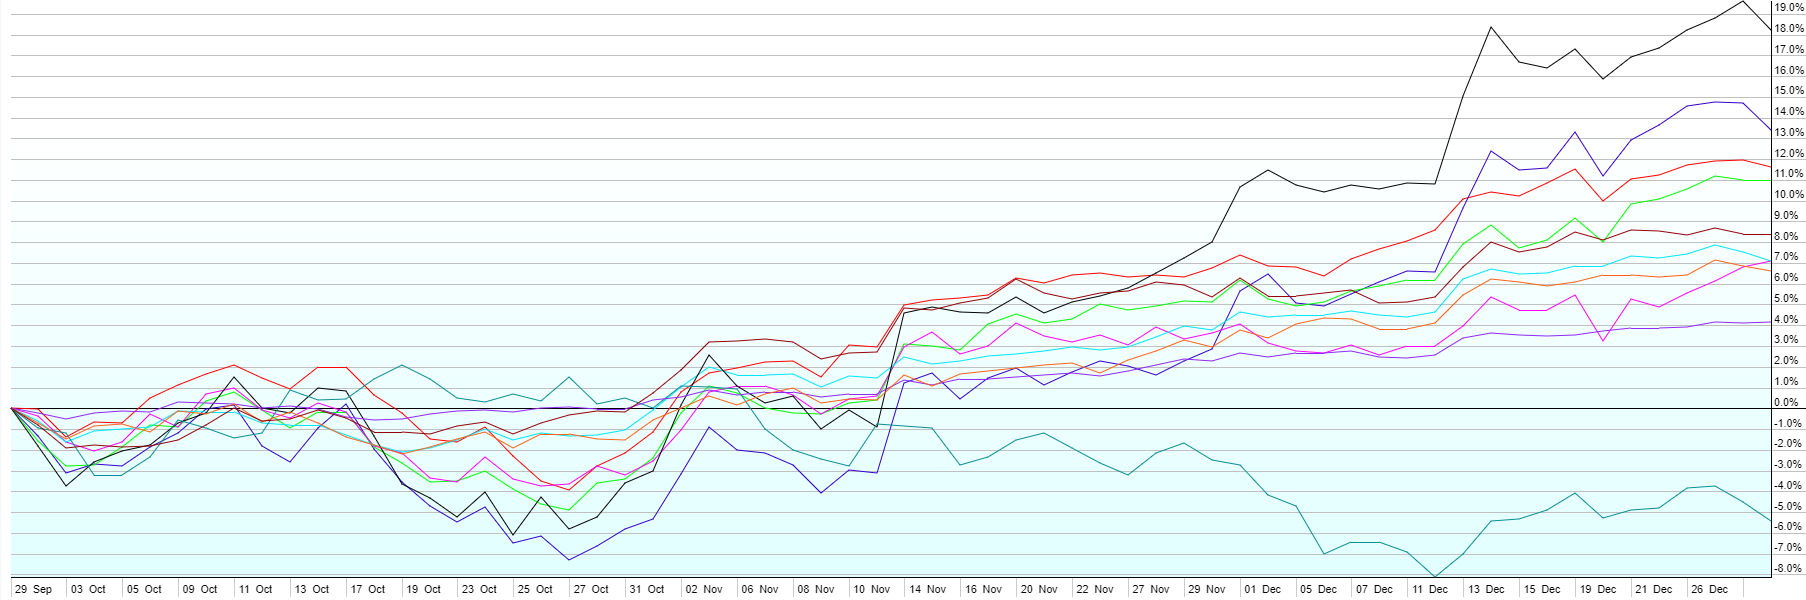
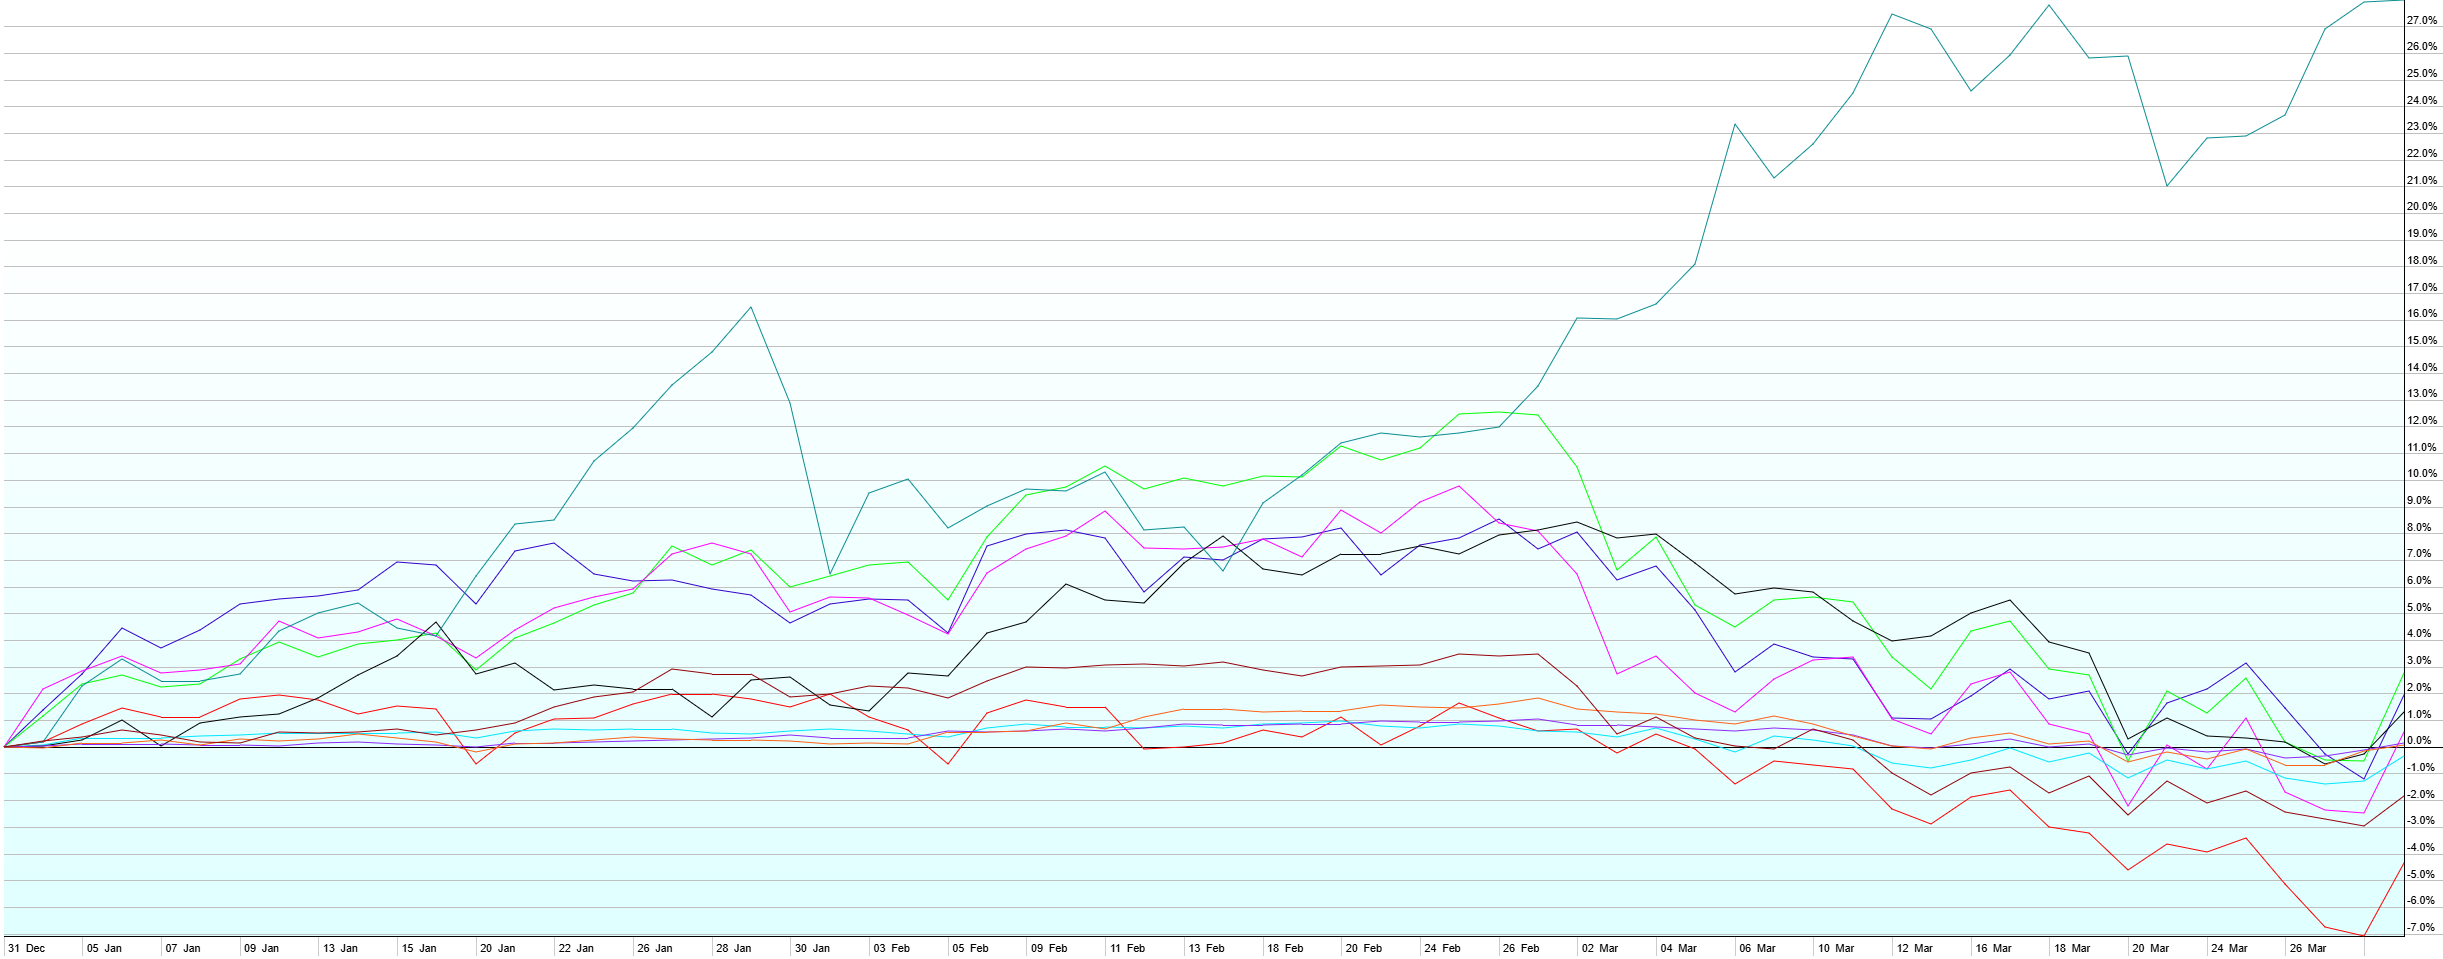
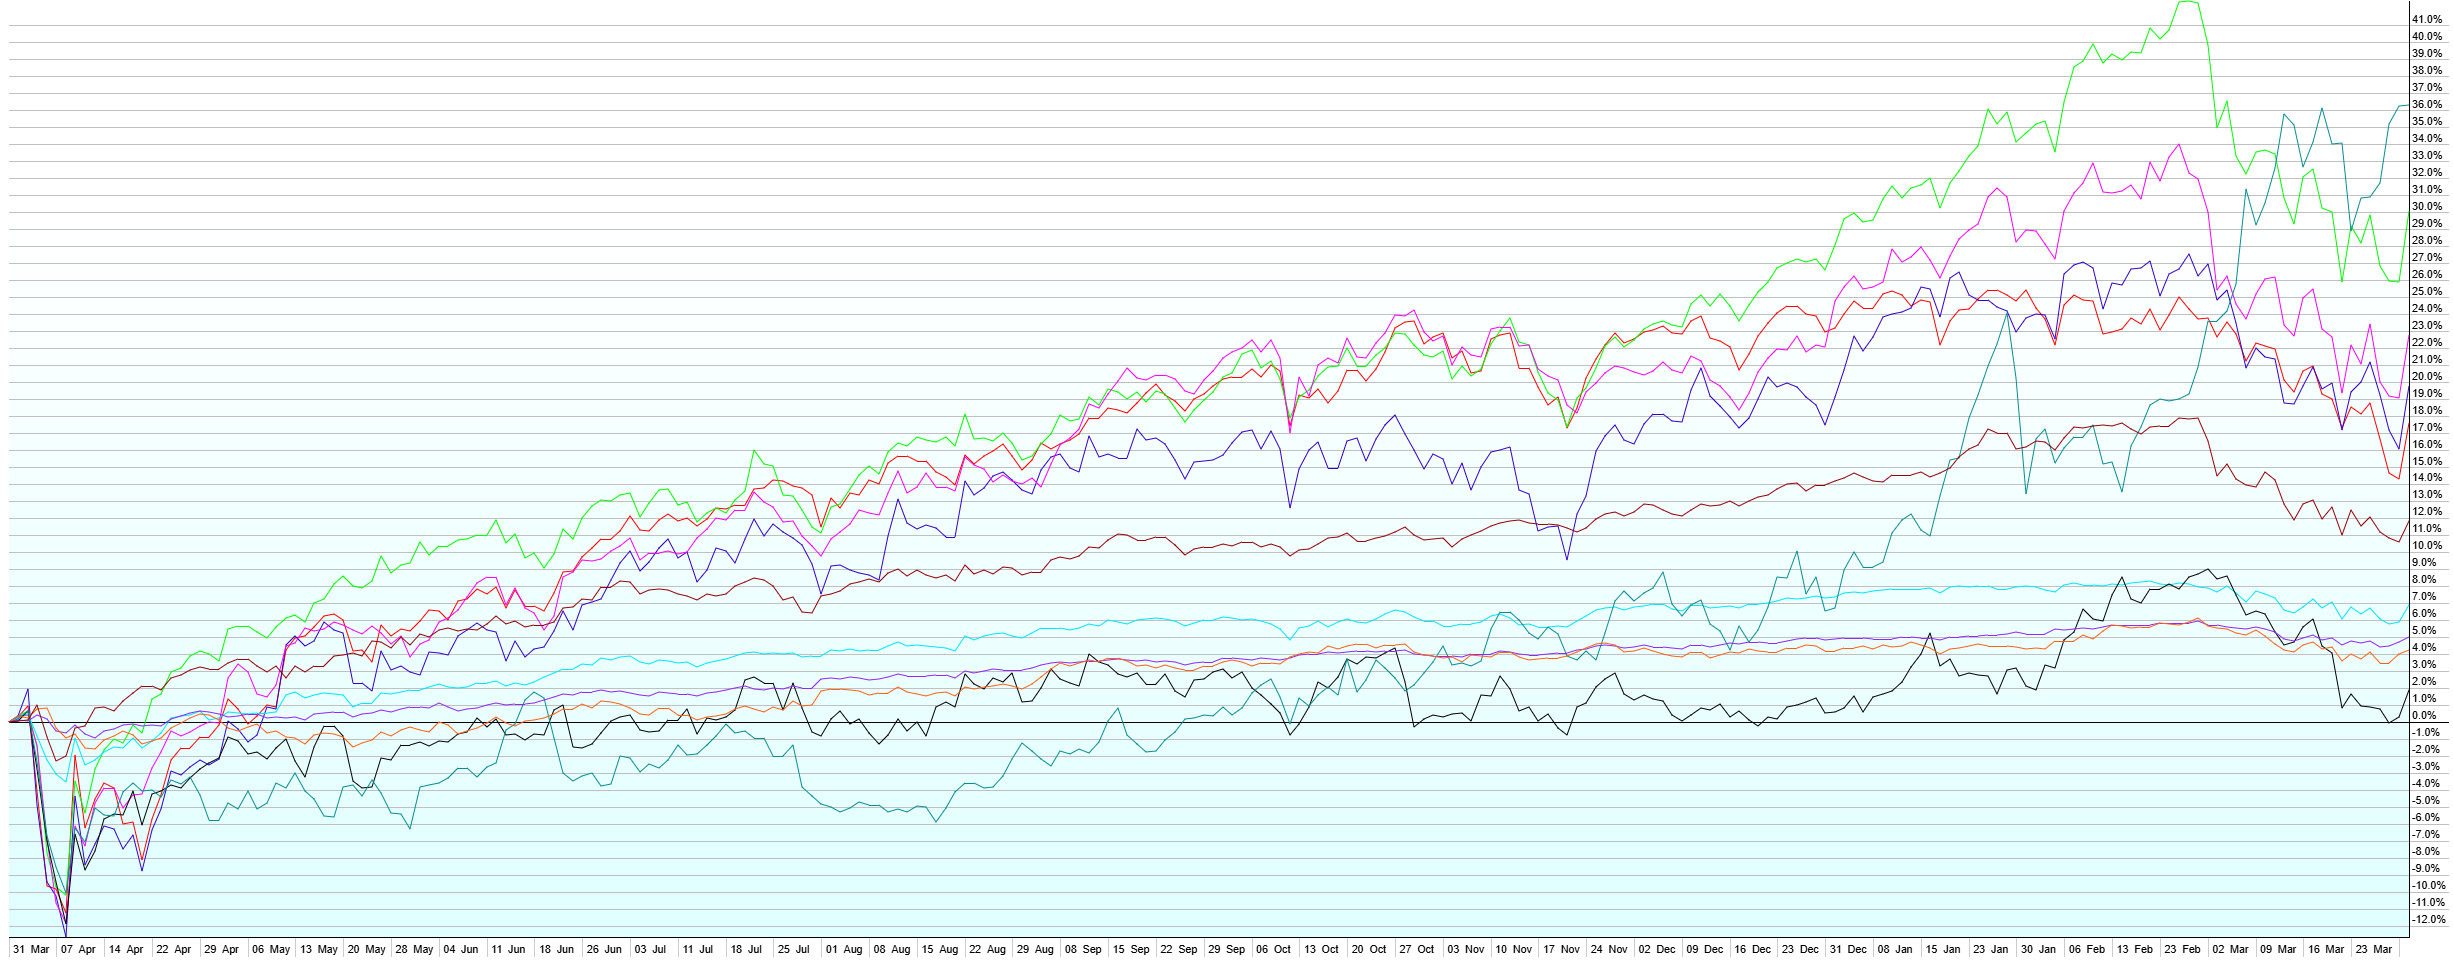
Higher energy prices resulting from the “military action” in Iran ground the stock rally to a halt in Q1. While there hasn’t been too much damage overall, at least not yet, stocks around the world are off their highs on the order 5-15%. Diversification paid off once again in Q1 with Commodities leading the way, up 28%. International Developed Stocks finished Q1 up 2.8%, mostly due to their stellar performance in Jan and Feb (they were up 12% at one point). US Small Caps (+1.9%) fared significantly better than Large Caps (-4.4%), which were the worst performer of the quarter. In the middle of the pack were US REITs (+1.4%), Emerging Market Stocks (+0.5%), US Aggregate Bonds (+0.1%), US Short-Term Corporate Bonds (+0.1%), US High-Yield Bonds (-0.4%), and Emerging Market Bonds (-1.9%). The market pulled back the odds more Fed cuts in 2026 substantially, going from 1-3 more cuts expected this year at the start of Q1 to 0-1 more cuts at the end of Q1. This is the result of higher energy prices, which could put pressure on broader inflation and cause the Fed to be more restrictive with policy. Much of the damage already done in the Middle East will have a lasting effect on energy prices, even if tensions ease immediately. It remains to be seen whether those higher energy prices restrict the global economy enough to decrease demand (recession) or if the economy continues to chug along with higher prices and even higher expectations of higher prices passing through to goods and services (inflation). The Fed, along with it’s incoming new chairman, is in a tough spot trying to price rates for a very uncertain future.
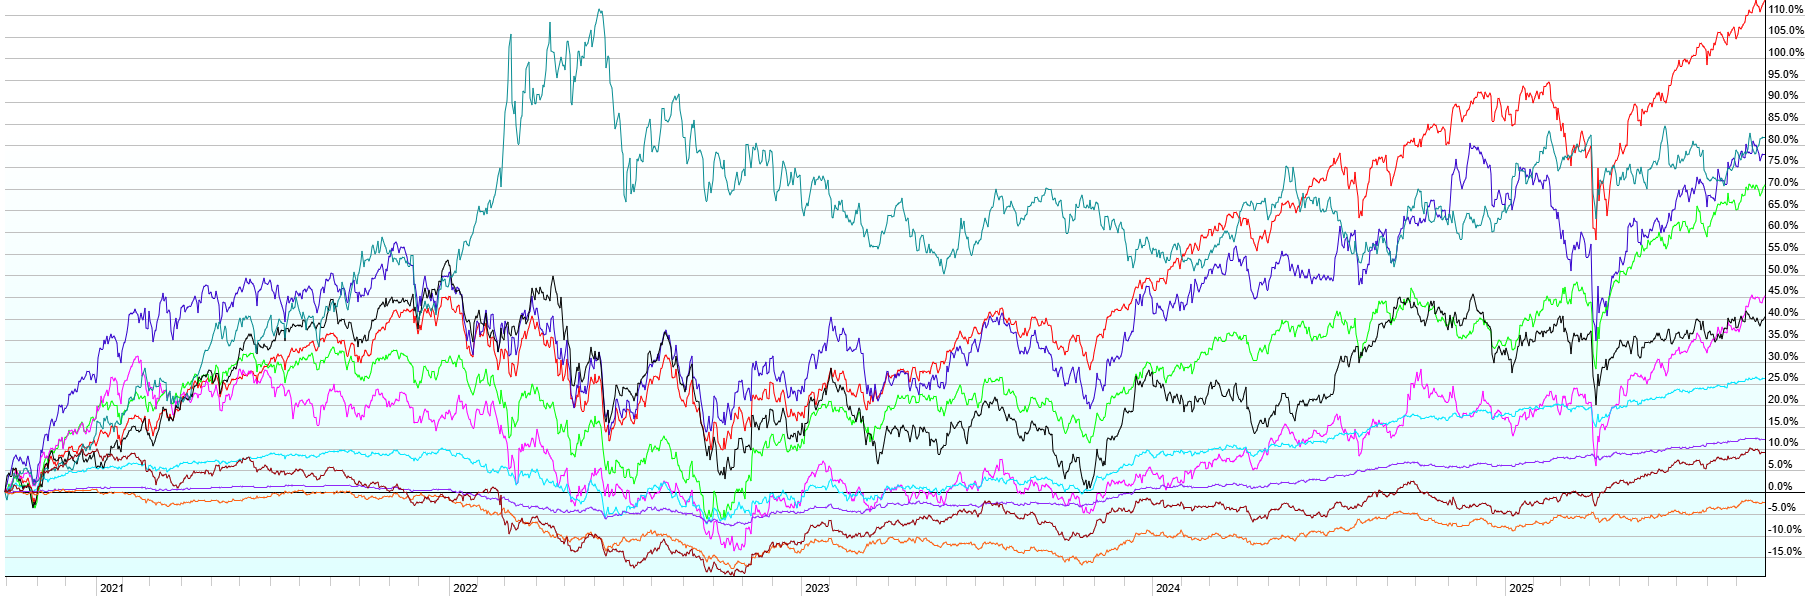
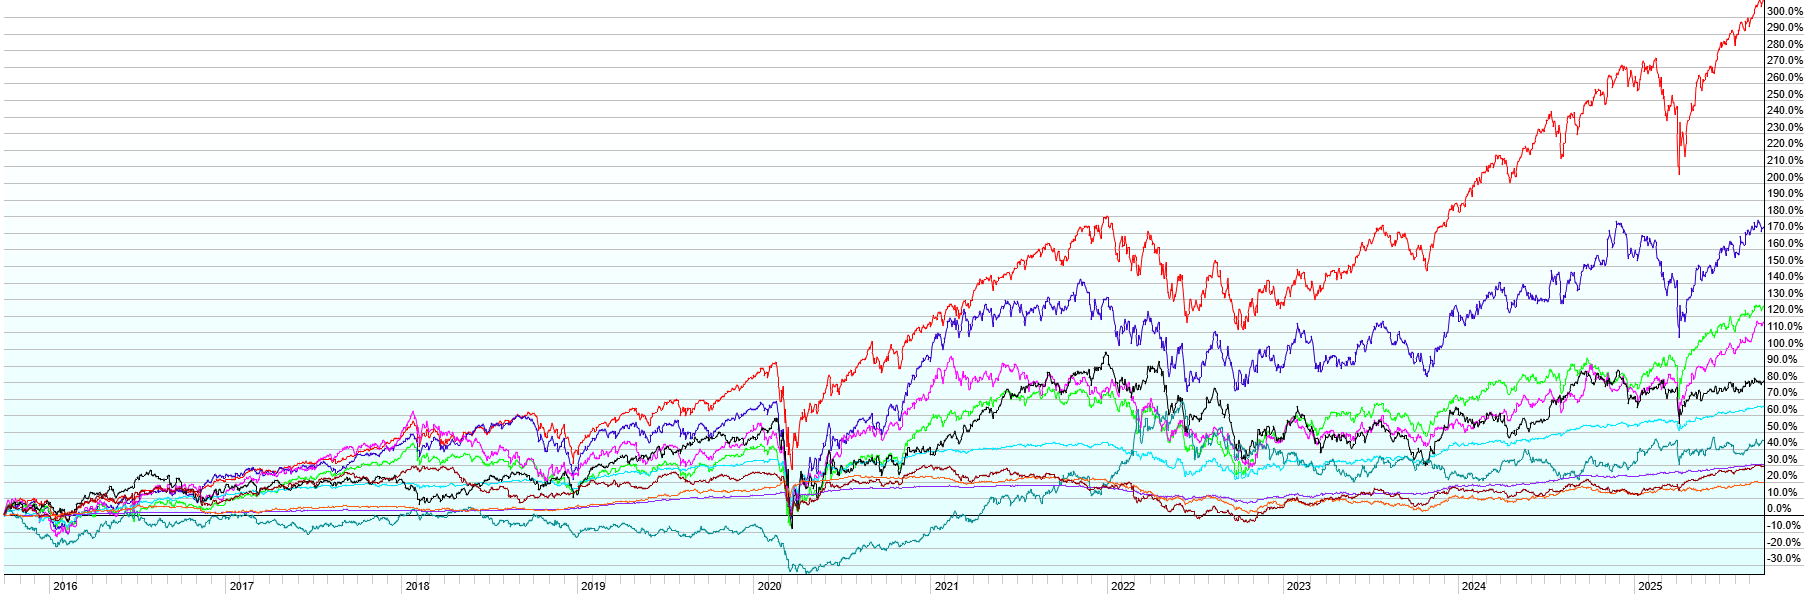
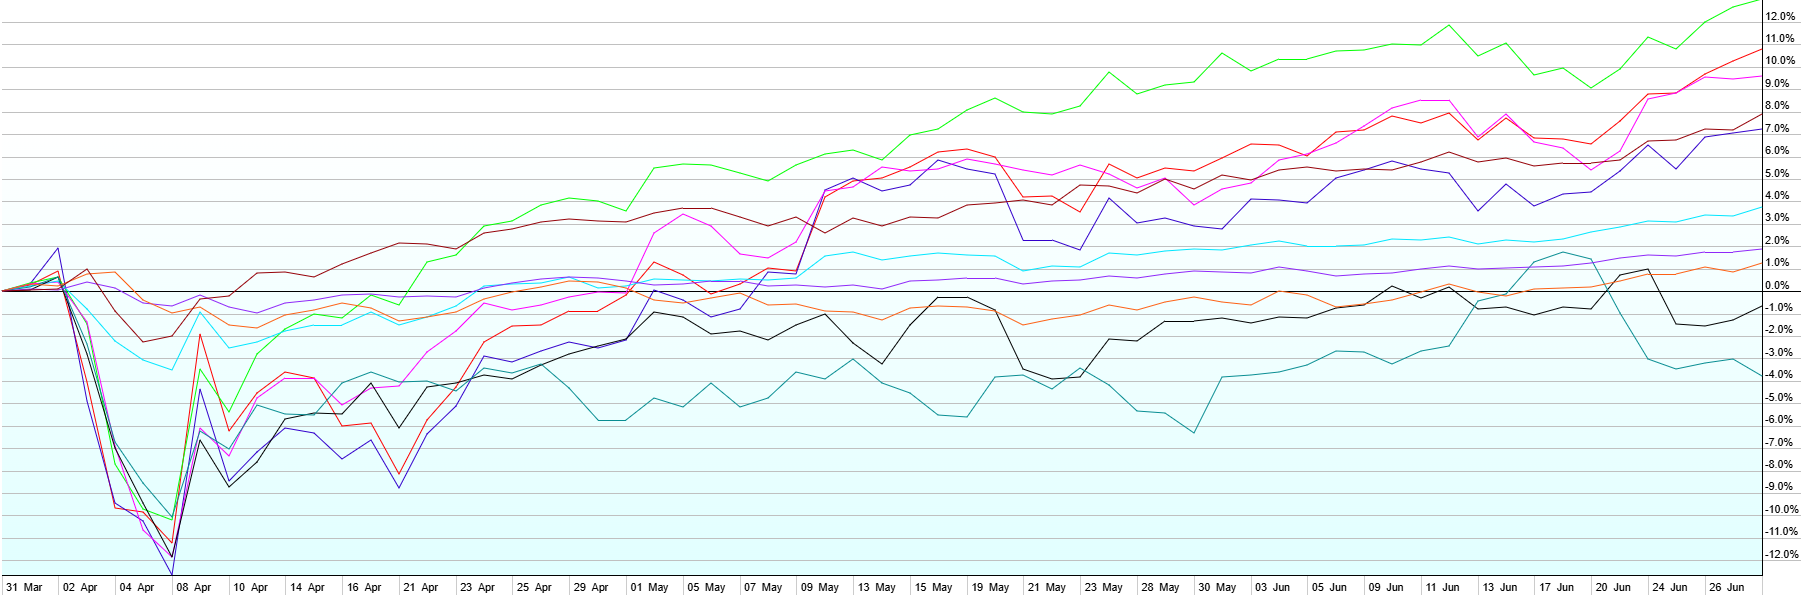
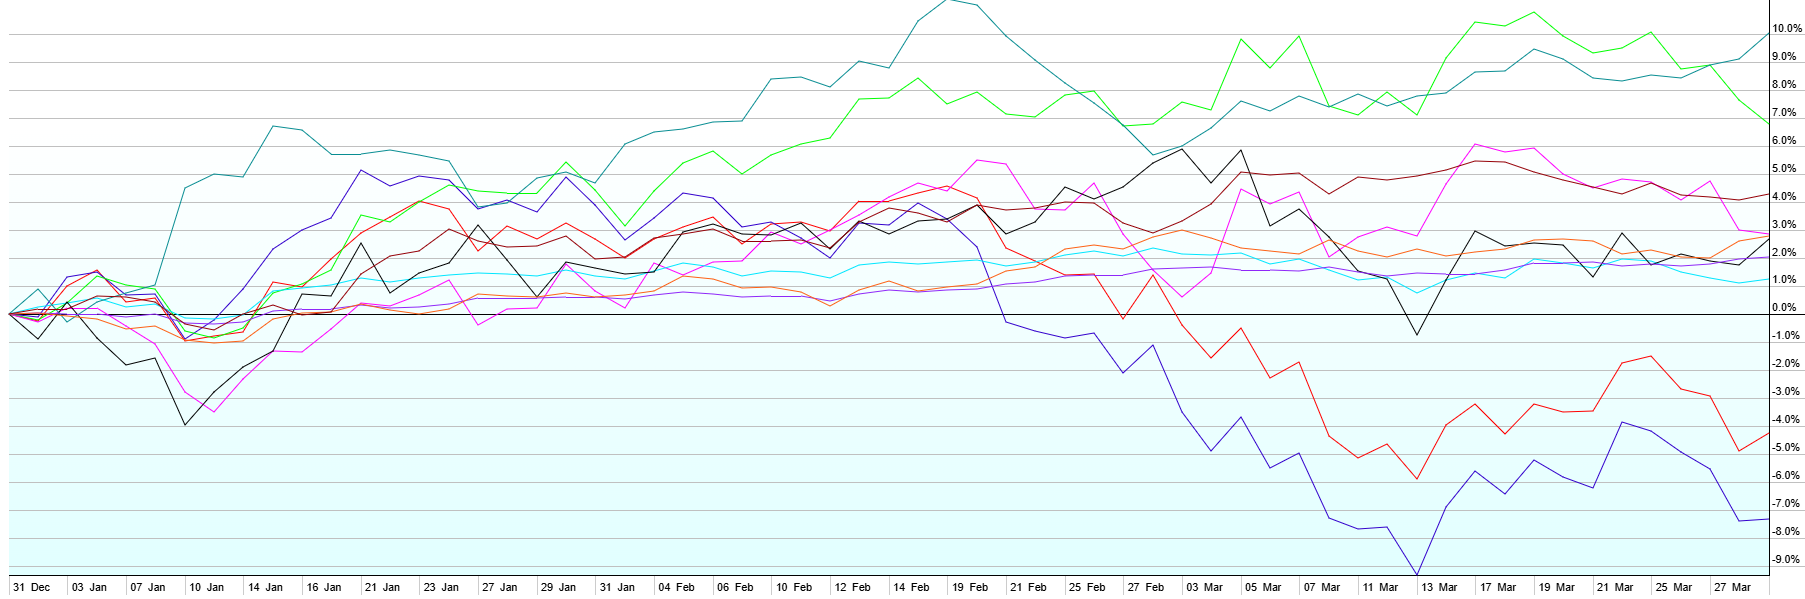
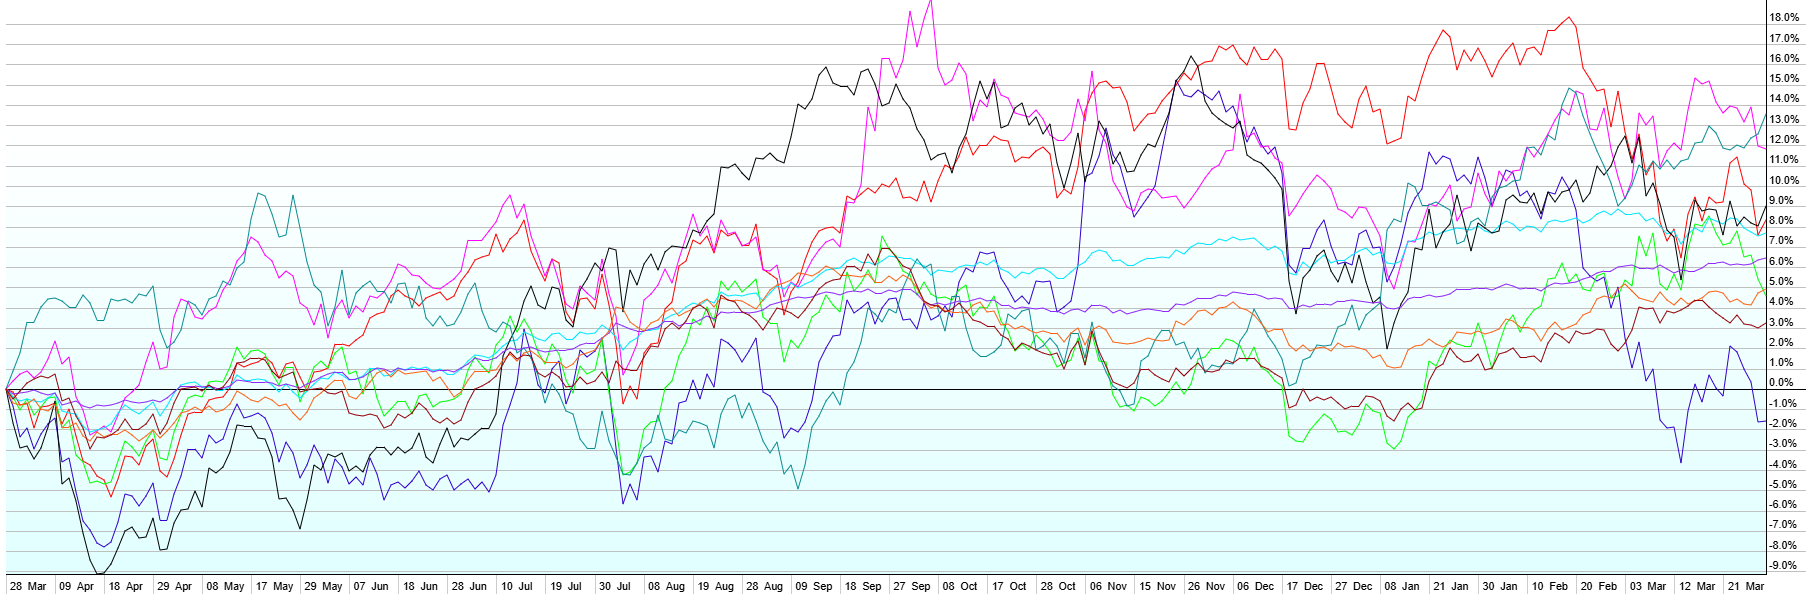
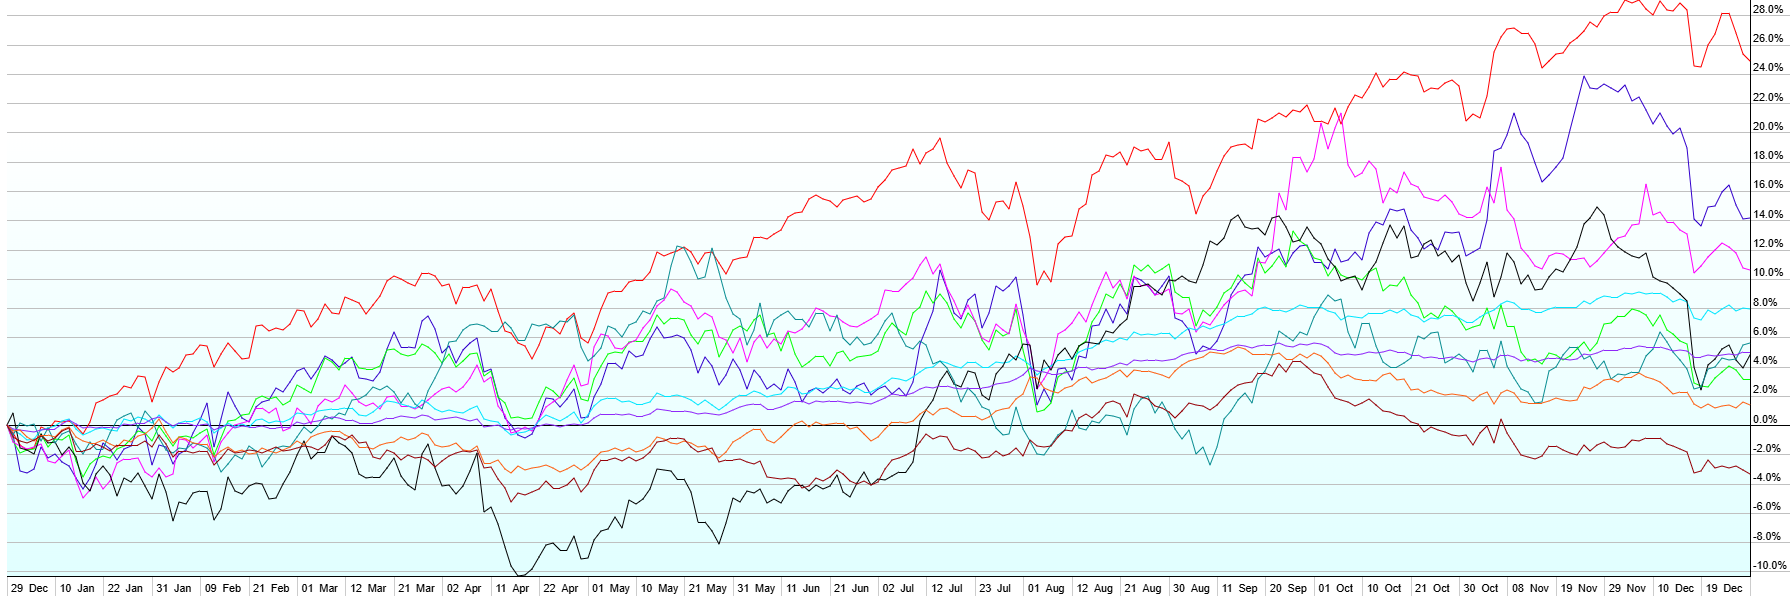
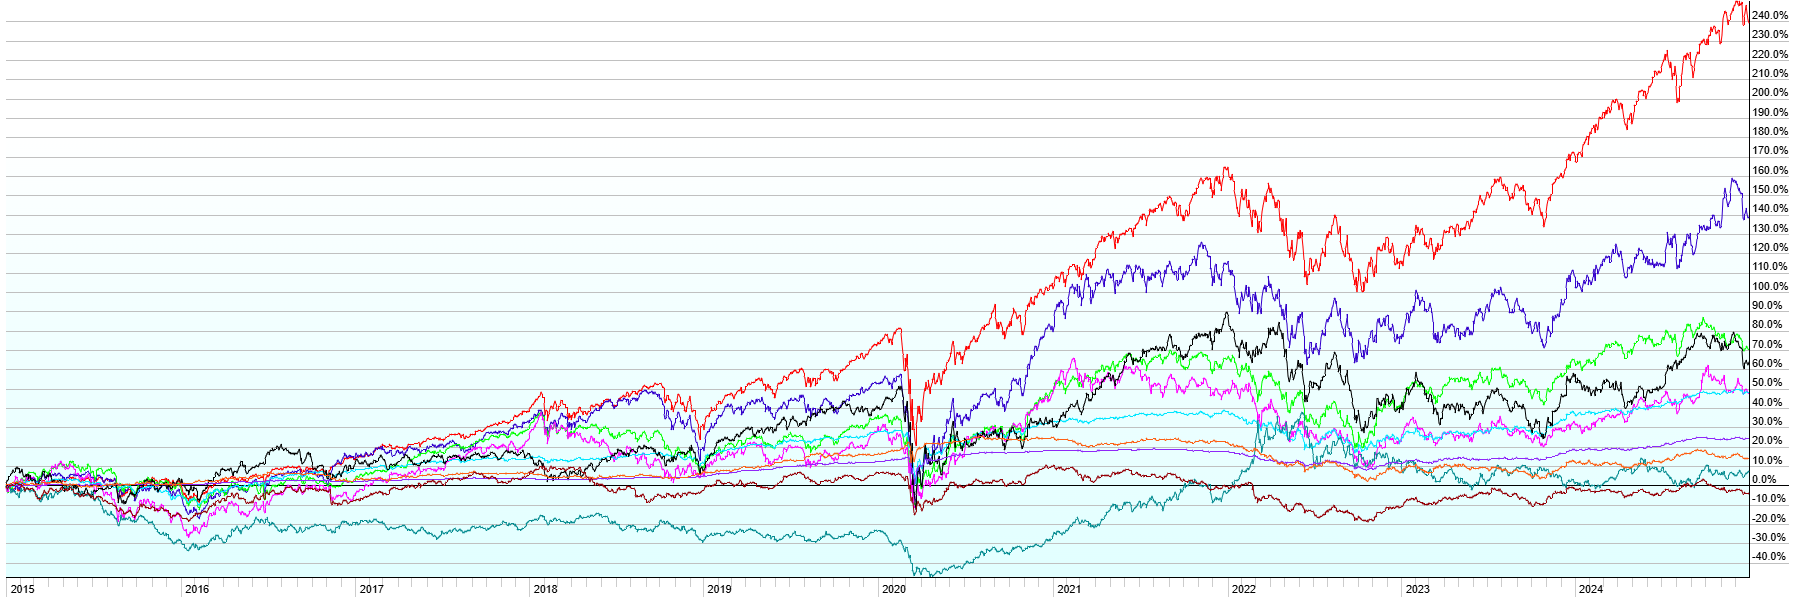
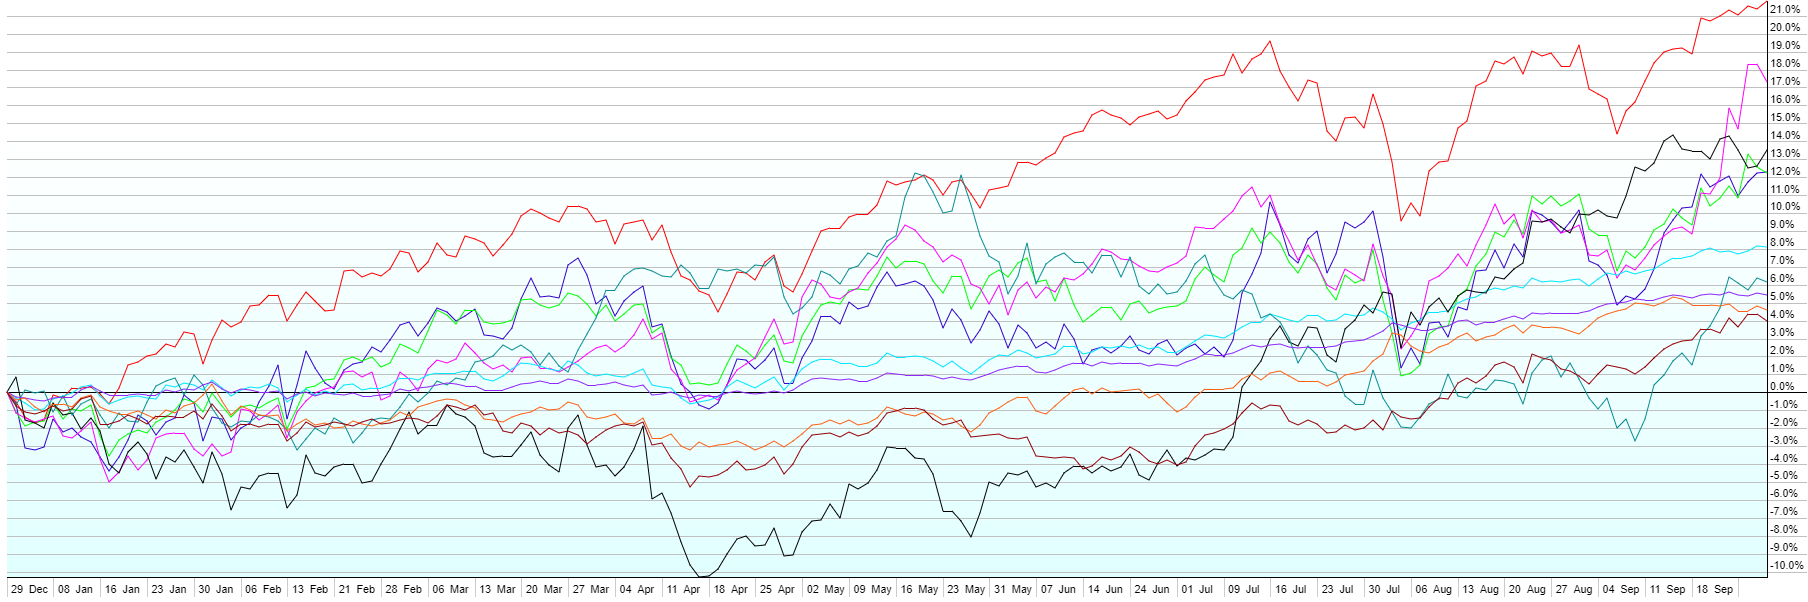
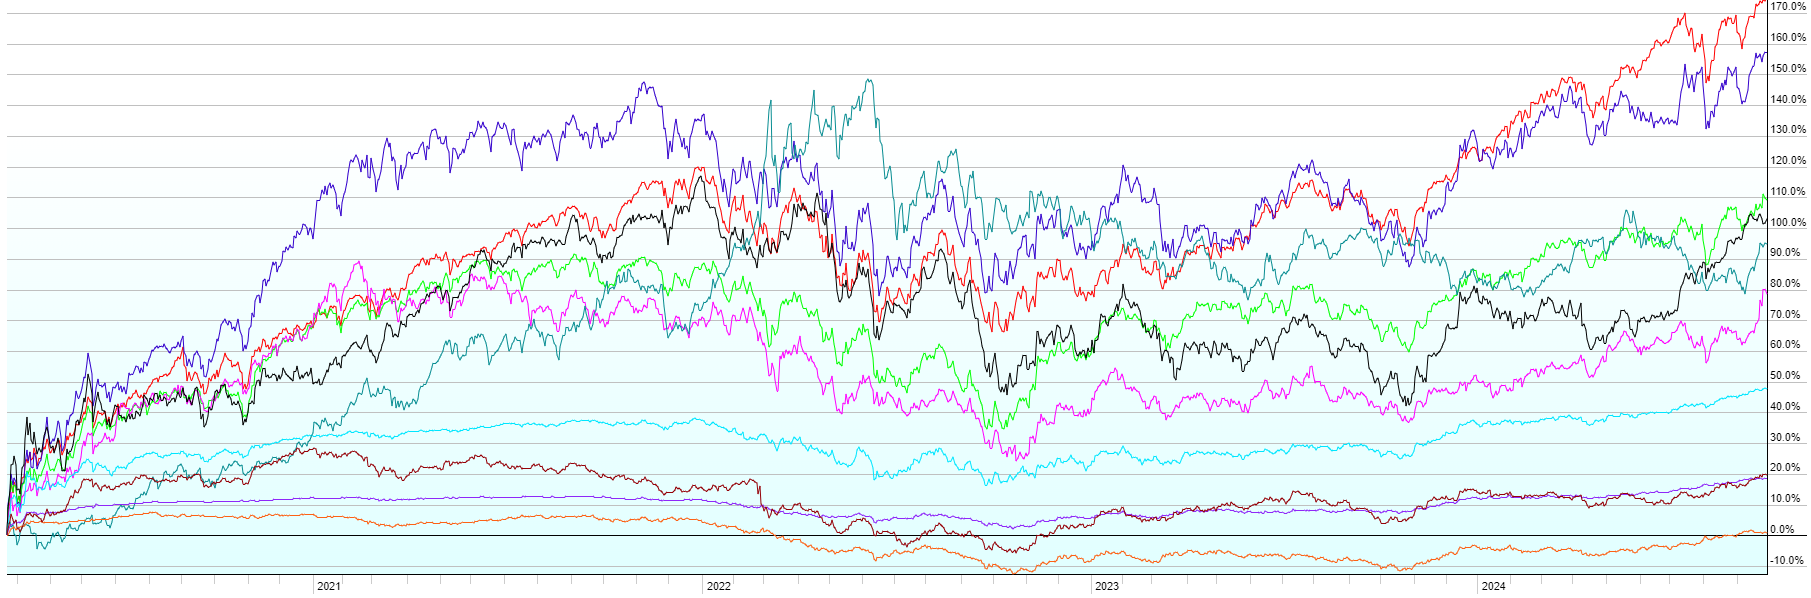
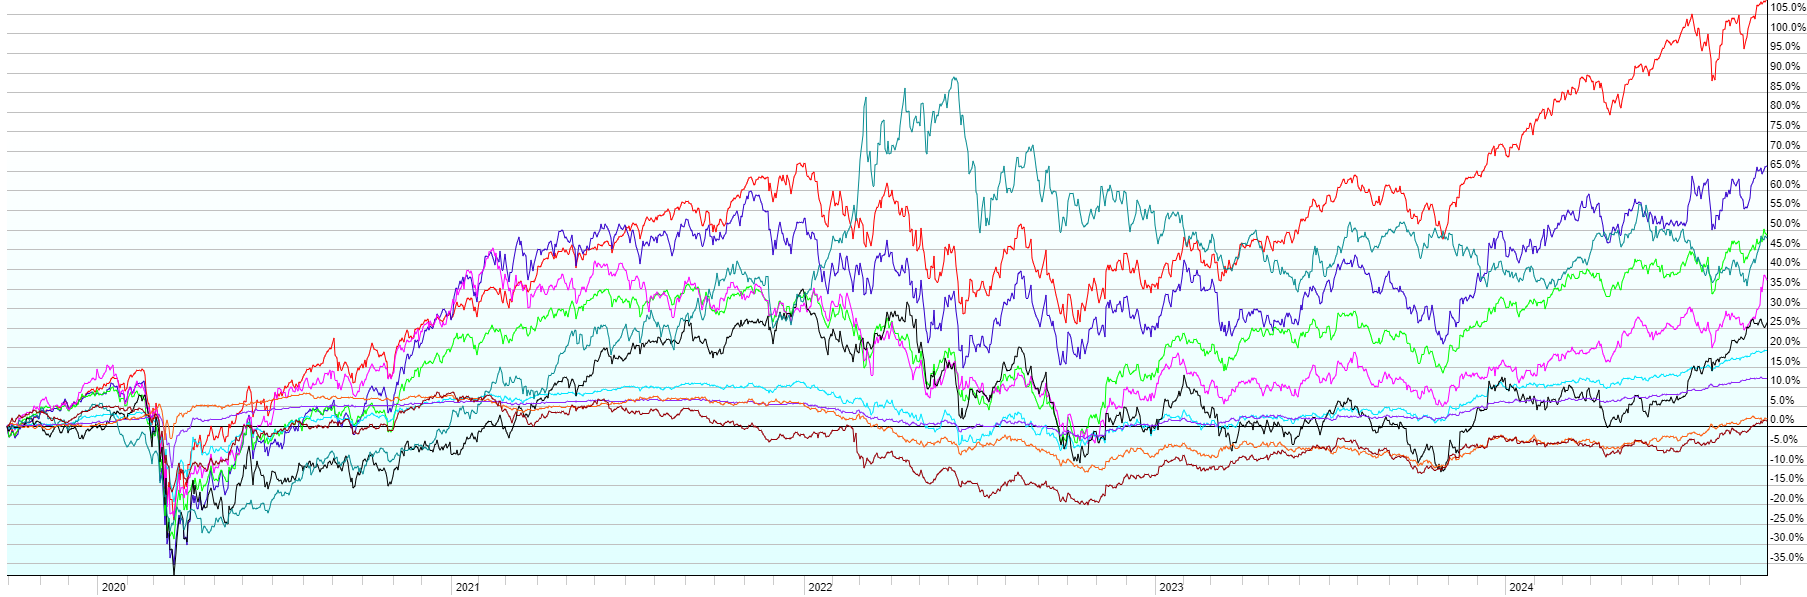
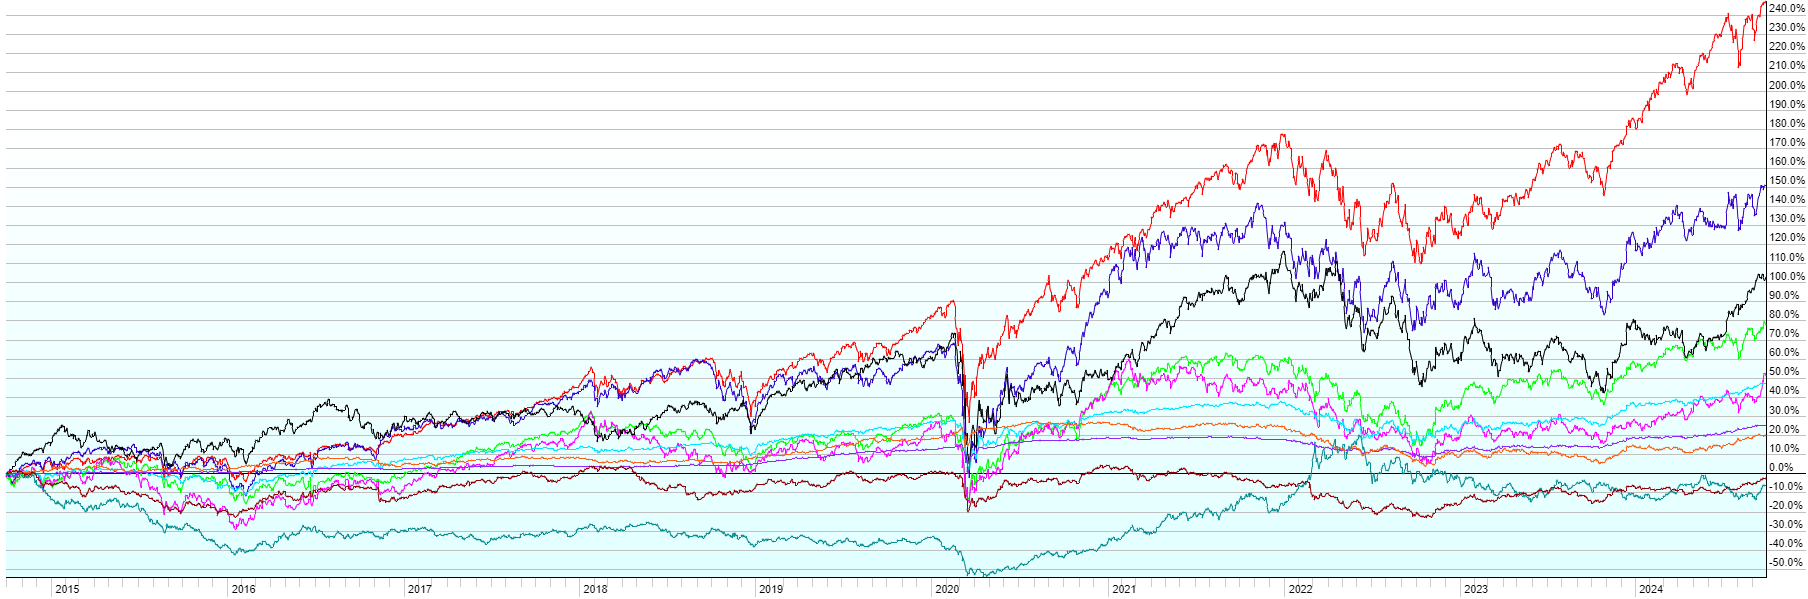
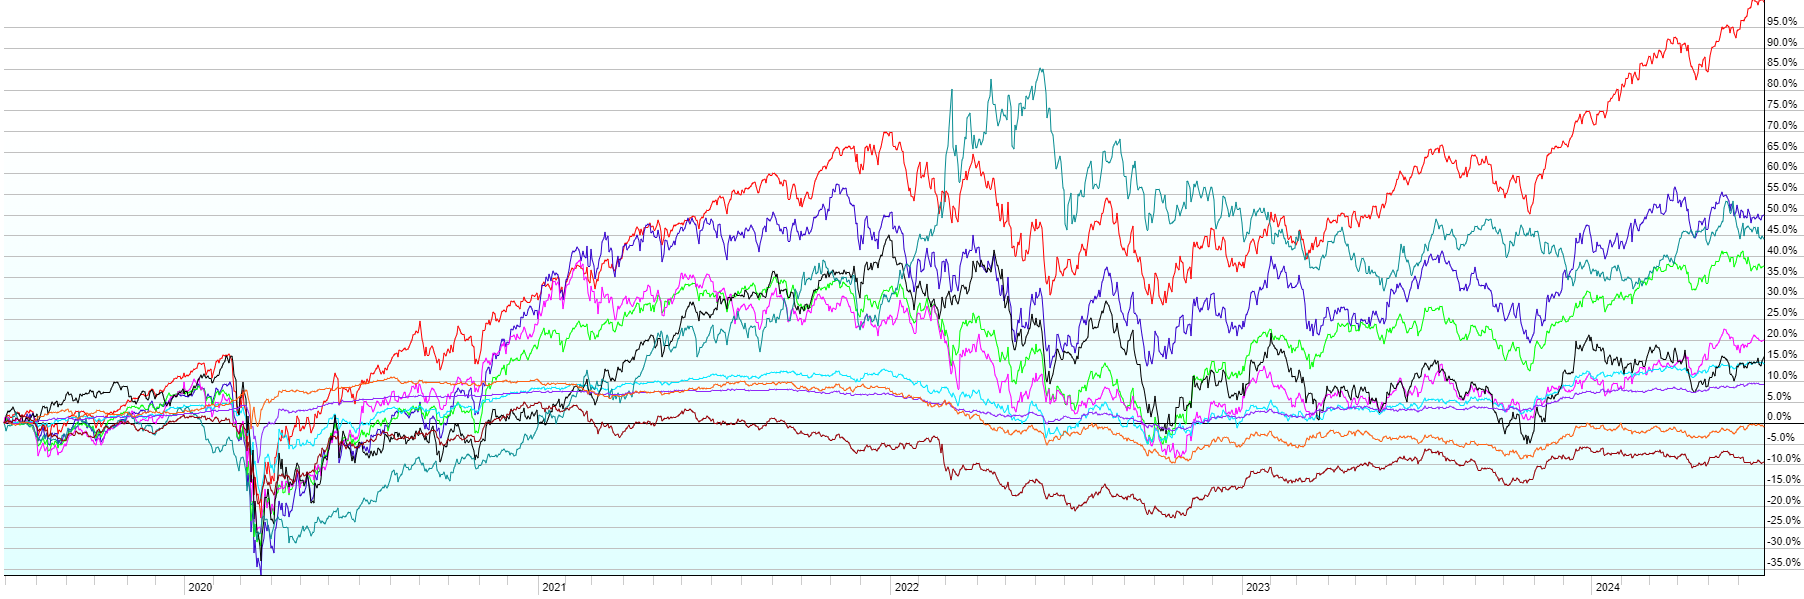
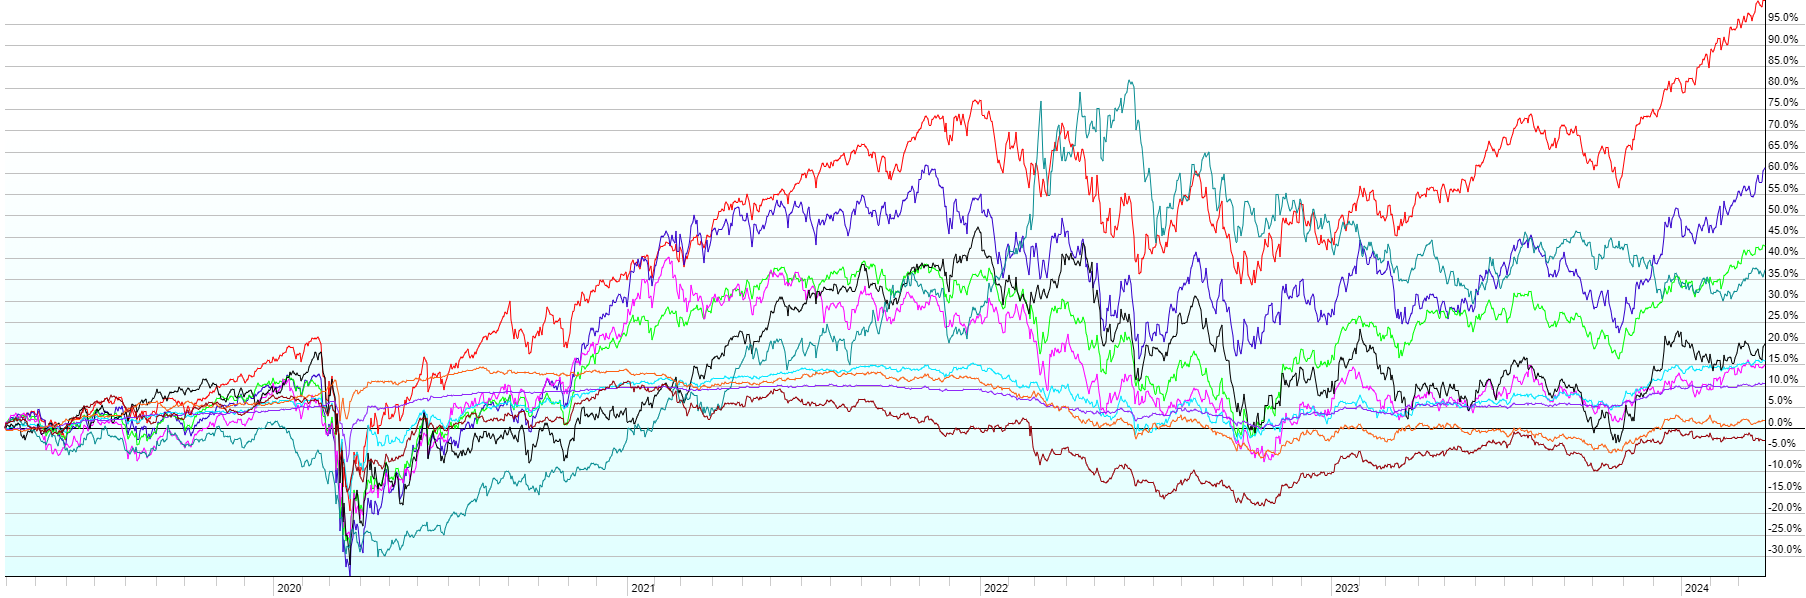
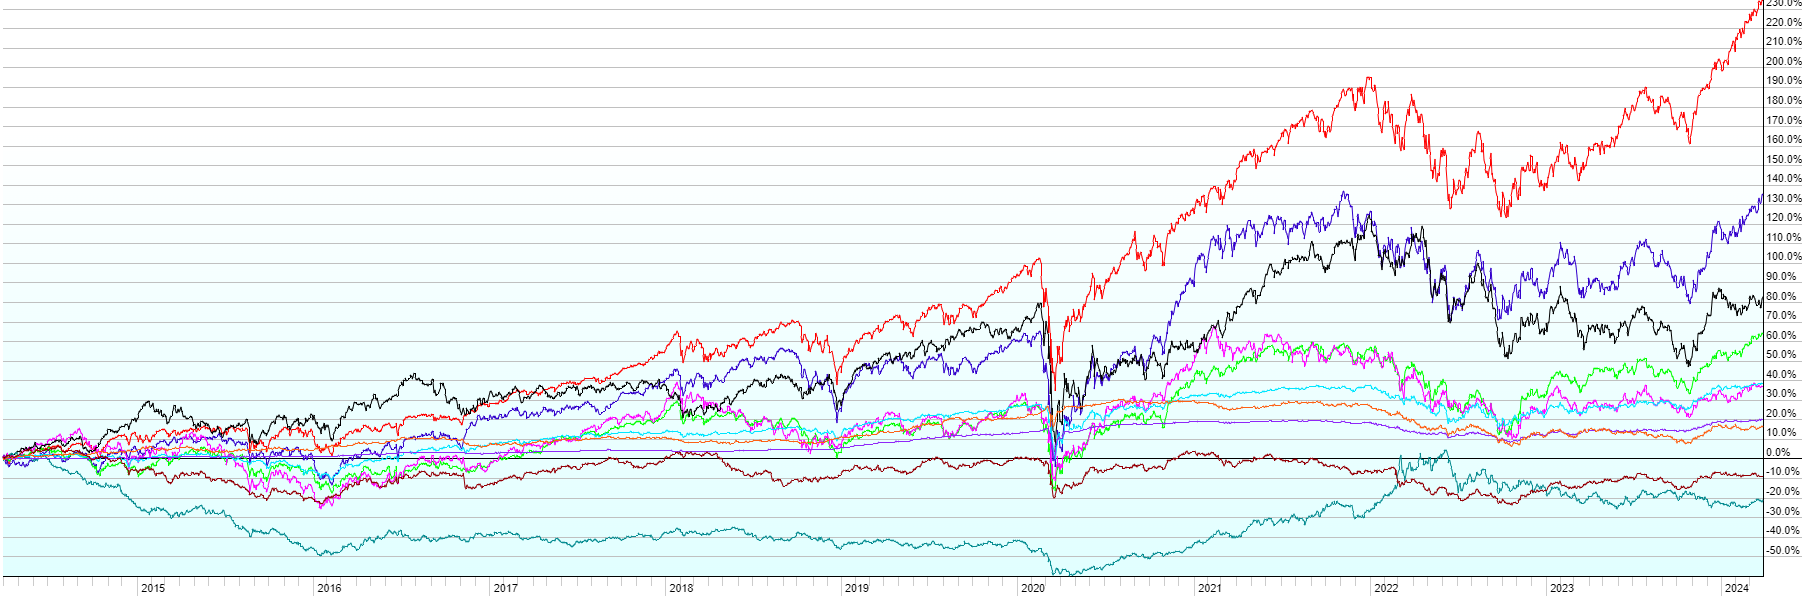
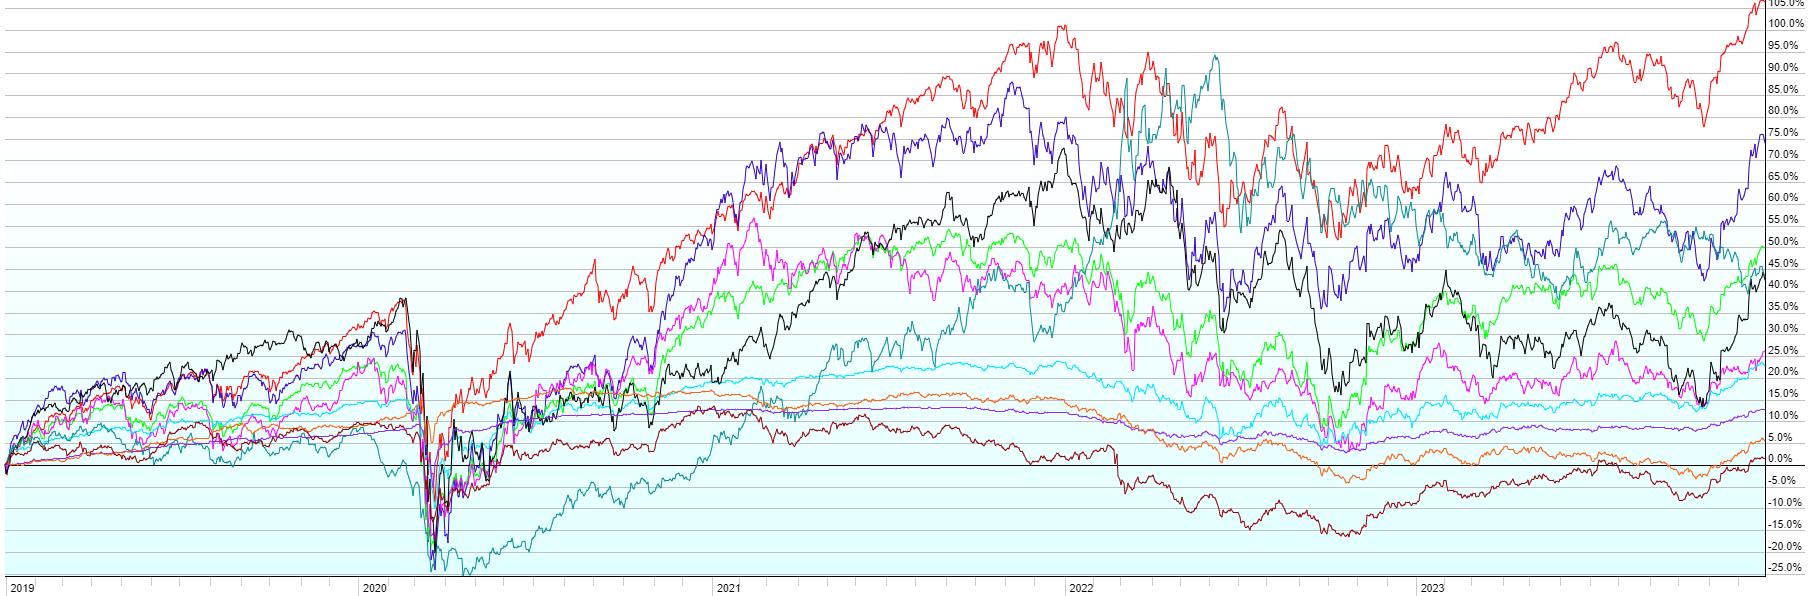
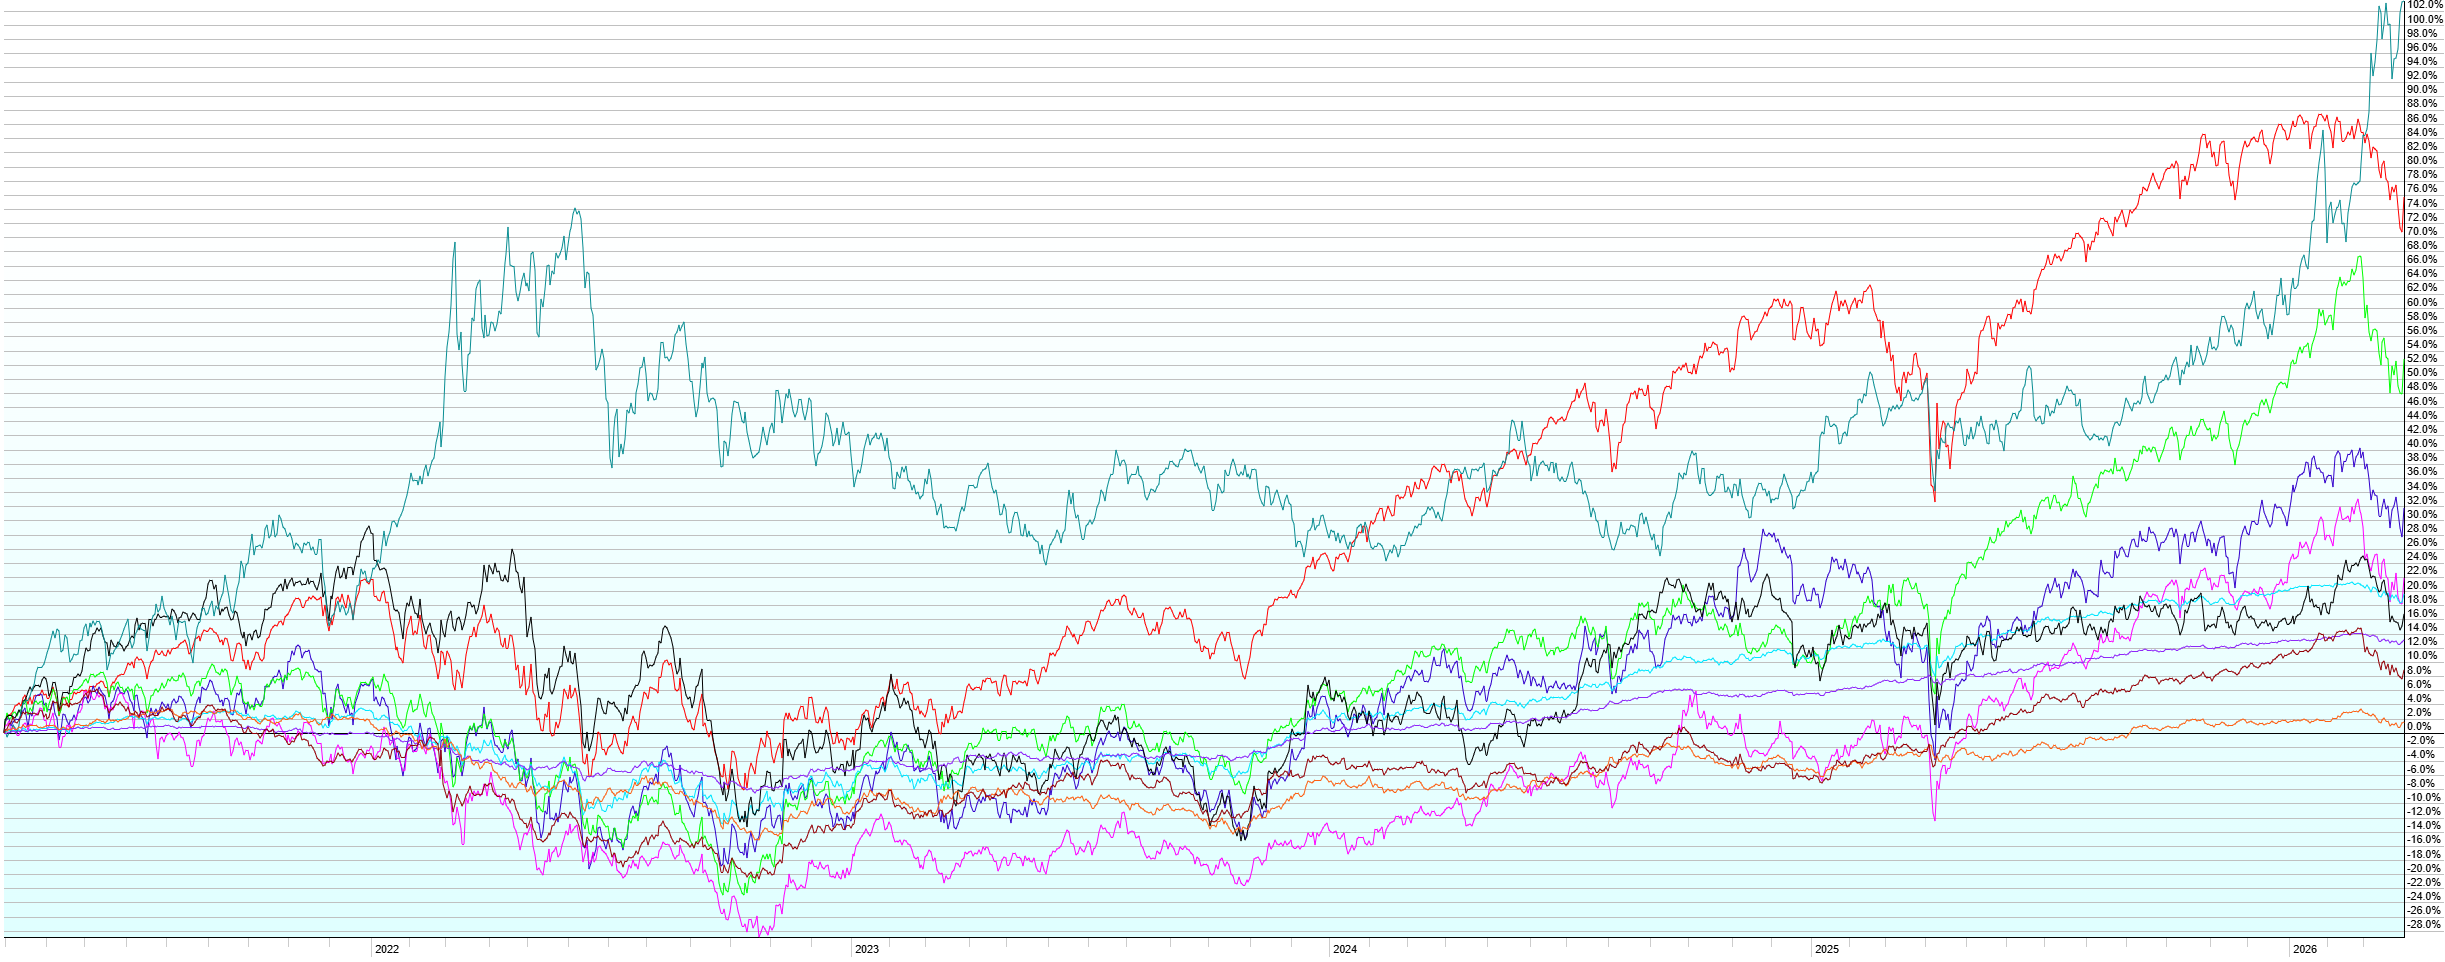
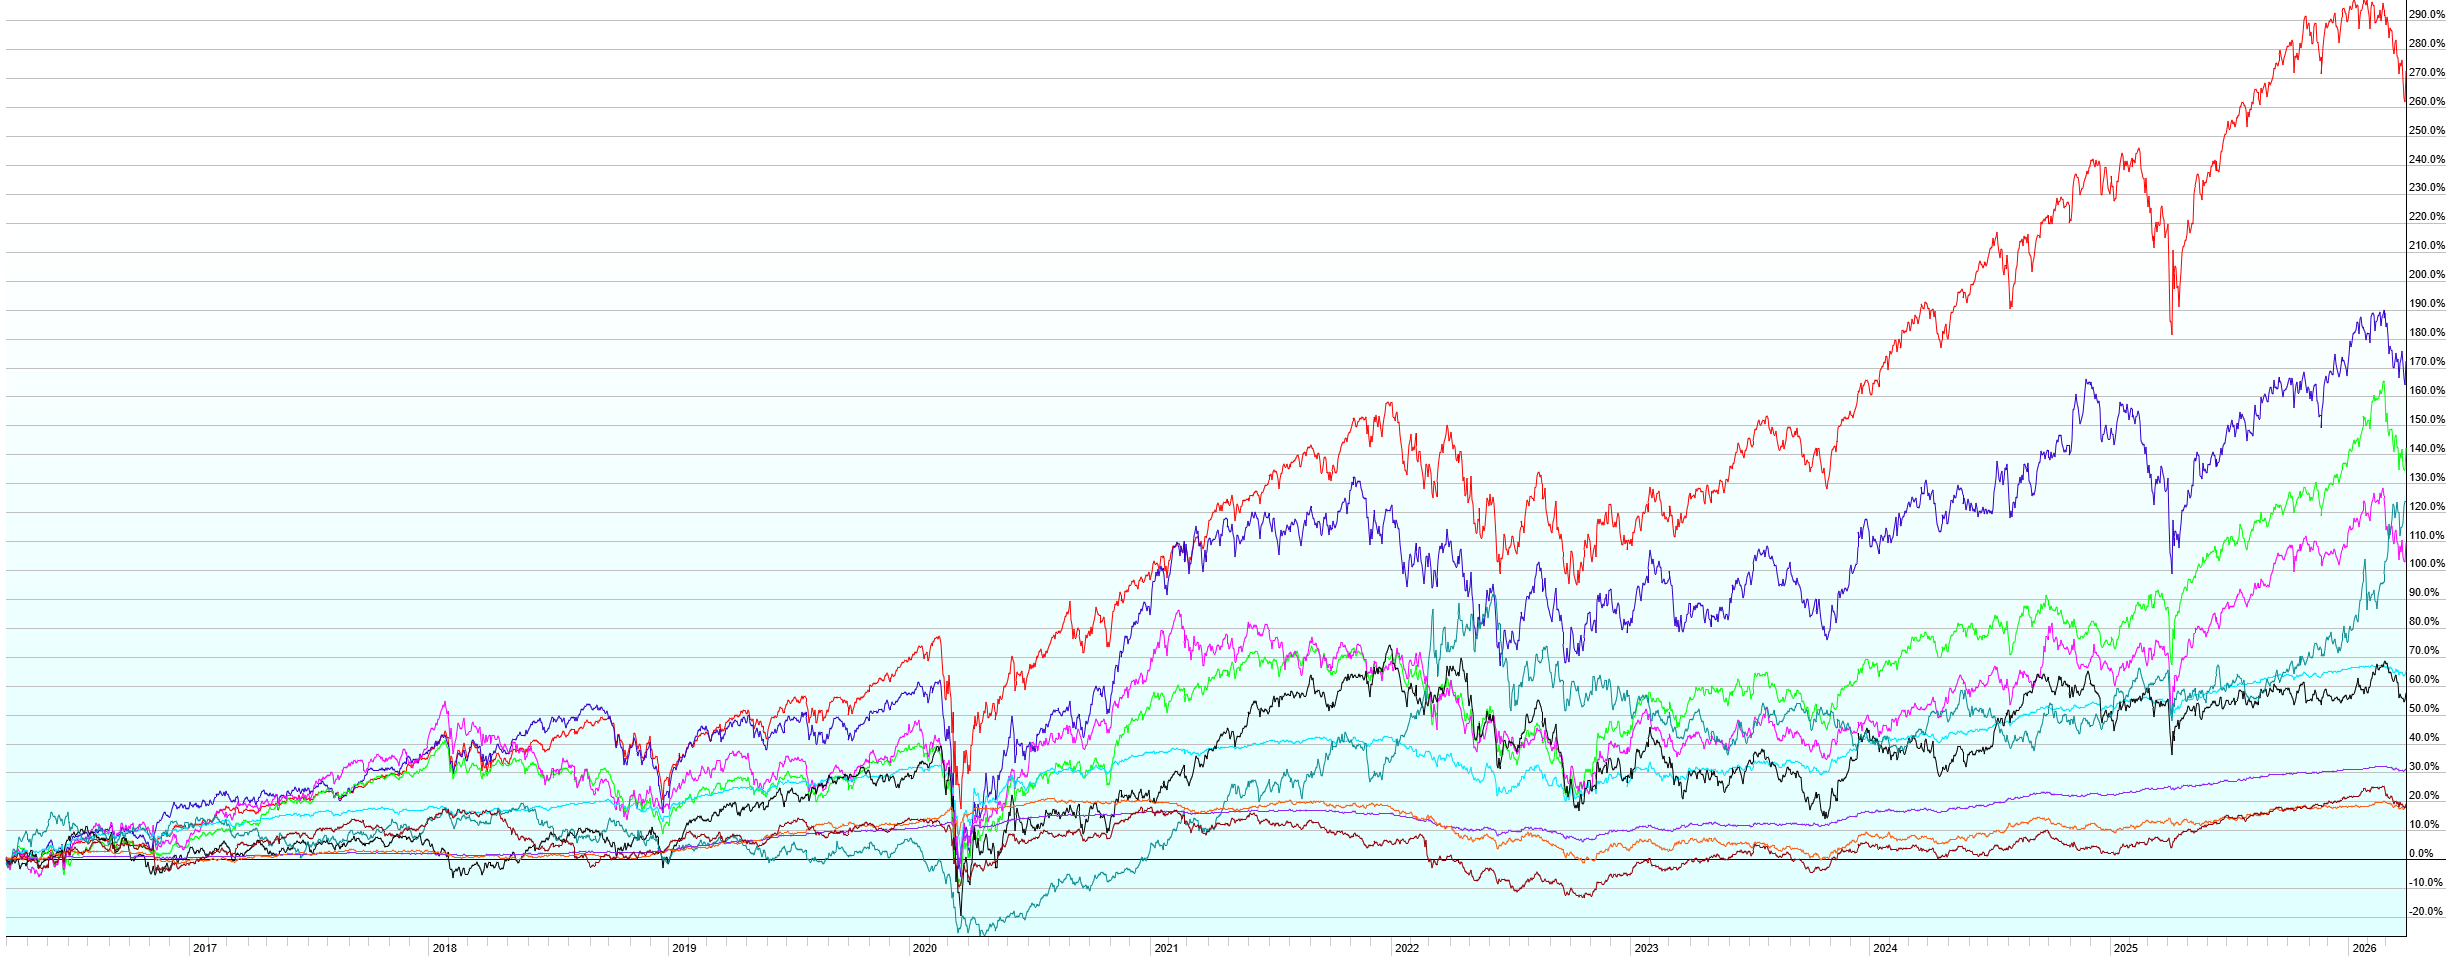
Note also the other charts as we’re now approaching the one-year anniversary of the “Liberation Day” selloff around the world. Despite tariffs, war in the Middle East, war in Ukraine, spiking energy prices, Trump, Biden, a global pandemic, US debt downgrades, natural disasters, and a host of other imperfect world issues most of us can’t even remember over the last decade, all major market segments are up over the last one, five, and ten years. There’s a lesson in there somewhere.