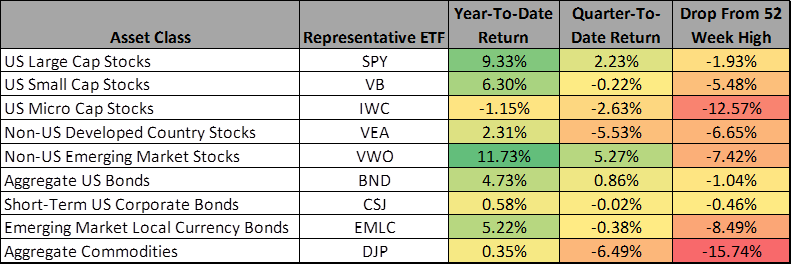
Withholding On Bonuses & Other Supplemental Wages

When you receive a bonus from your employer, have restricted stock vest, have taxes collected on the cashless exercise of a stock option, or receive any other form of supplemental wages, you may have too much or too little tax withheld depending on your marginal tax bracket and the method your employer uses for tax withholding. On a normal (non-bonus paycheck), payroll withholding tables take the amount of taxable income you earn for the pay period and translate that to the amount of tax that should be withheld, using the marginal tax brackets for your filing status (from your W-4), the number of allowances you claim (from your W-4), and number of pay periods in a year. For example, if you claim “Single, with 0 allowances”, you earn $8k in a pay period, and you are paid bi-weekly (26 x per year), the withholding tables will determine the projected annual tax liability based on the Single tax brackets, $8,000 * 26 = $208,000 of projected taxable income for the year. Dividing by 26 gives the Federal withholding amount for the pay period.

From the example above, you should be able to see how wildly the withholding rate can vary if your paycheck varies from period to period, which is why it is so hard to accurately set your withholding and why you never seem to get the same refund or owe the same amount year after year. (Add in exemptions, deductions, and credits, and it gets even more difficult). If you receive bonus pay as part of your regular pay, your employer can combine the two and determine the withholding on that paycheck based on the extrapolated annual income if you earned that amount each pay period. In this case, your projected annual income and the withholding tax rate will be very high because 26 * your combined wage and bonus is a very large number. You’d therefore have more withholding than is necessary for the period and would accumulate that amount toward a tax refund when you file. The more typical scenario is that your bonus would be paid either as a separate paycheck, or as a separate line item on your regular paycheck but considered as supplemental wages. In both of these cases, a statutory 25% withholding rate is used for the supplemental wages. If your marginal tax bracket is actually higher than 25% (taxable income over about $90k as a single filer, or over $150k as a married couple), then you’d have less withholding than is necessary for the period. That would accumulate toward an amount you’d owe when you file your taxes. In an extreme example, let’s say that you earn $250k per year as a single filer (33% tax bracket), but that you have an windfall of an additional $250k (bonus, stock, whatever). That $250k windfall is taxed at 25% when it should be taxed at ~35%, meaning you’d stand to owe $25k in tax when you file for that tax year.

The moral of the story is to be careful whenever you receive a bonus (or earn some other form of supplemental income like vesting equity). If the following conditions exist, it may cause you owe a substantial amount of tax at the end of the year:

1) It is paid in a separate paycheck, as supplemental wages on your normal paycheck, or withheld automatically as part of an equity transaction

2) You earn more than $90k per year (single) or $150k per year married, including the bonus payment.

Note that the tax is the same whether it is appropriately withheld at the time of the bonus payment or if you pay it at the end of the year. The problem isn’t that you pay additional tax. The potential problem is that you may owe a lot of tax and may not have been prepared for it (e.g. you used the bonus for a downpayment on a house or to payoff debt, and don’t have the cash remaining to pay your tax). It’s always a good idea to keep 10-15% of your gross bonus tucked away to make sure you have it available for taxes if needed. If you need a more detailed estimate of the potential tax impact of a large bonus payment, contact your financial advisor.

Starting Salaries

A lot goes into figuring out what you want to be when you grow up. Money is far from everything, but it’s definitely a factor, especially if you know you’re going to be graduating with a substantial amount of student debt and need an income that will allow you to pay it back. For all the parents out there reading this, payscale.com ranks college majors by median starting salary and gives an indication of median mid-career salary as well (list included below for your reference). No surprise in that engineering, math, and science dominate the top of the list. Also on their site, you can find the Best Schools By Major, Best Schools By Region, advice on choosing a major, and a copious amount of other information. Check it out as just one more resource to help coach college bound seniors and younger children to make important choices that may determine their career, earning potential, and happiness in adulthood.

RANK MAJOR STARTING SALARY MID-CAREER SALARY
1 Petroleum Engineering $103,000 $160,000
2 Actuarial Mathematics $58,700 $120,000
3 Nuclear Engineering $67,600 $117,000
4 Chemical Engineering $68,200 $115,000
5 Aerospace Engineering $62,800 $109,000
6 – tie Electrical Engineering (EE) $64,300 $106,000
6 – tie Computer Engineering (CE) $65,300 $106,000
8 Computer Science (CS) $59,800 $102,000
9 Physics $53,100 $101,000
10 Mechanical Engineering (ME) $60,900 $99,700
11 Materials Science & Engineering $62,700 $99,500
12 Software Engineering $60,500 $99,300
13 Statistics $52,500 $98,900
14 Government $43,200 $97,100
15 Economics $50,100 $96,700
16 Applied Mathematics $52,800 $96,200
17 Industrial Engineering (IE) $61,100 $94,400
18 Management Information Systems (MIS) $53,800 $92,200
19 Biomedical Engineering (BME) $59,000 $91,700
20 Civil Engineering (CE) $54,300 $91,100
21 Environmental Engineering $49,400 $89,800
22 – tie Construction Management $51,500 $88,800
22 – tie Mathematics $49,400 $88,800
24 Electrical Engineering Technology (EET) $57,900 $87,600
25 Computer Information Systems (CIS) $50,800 $87,400
26 Information Systems (IS) $51,900 $87,200
27 Finance $49,200 $87,100
28 International Relations $41,700 $85,700
29 Geology $46,100 $85,300
30 – tie Chemistry $44,100 $84,100
30 – tie Information Technology (IT) $49,900 $84,100
32 – tie Biotechnology $48,700 $84,000
32 – tie Mechanical Engineering Technology (MET) $54,100 $84,000
34 – tie Supply Chain Management $52,800 $83,700
34 – tie International Business $43,800 $83,700
36 Industrial Design (ID) $44,800 $82,200
37 Industrial Technology (IT) $50,800 $81,500
38 Telecommunications $43,100 $81,200
39 Food Science $45,200 $80,500
40 Occupational Health and Safety $50,500 $80,300
41 – tie Biochemistry (BCH) $42,900 $80,200
41 – tie Marketing Management $42,100 $80,200
43 Civil Engineering Technology (CET) $49,200 $79,700
44 Advertising $40,000 $79,400
45 Philosophy $39,700 $78,300
46 Marketing & Communications $40,200 $77,600
47 Fashion Design $39,400 $77,100
48 Political Science (PolySci) $41,700 $77,000
49 Linguistics $39,700 $76,800
50 Molecular Biology $40,400 $76,400
51 Architecture $41,900 $75,800
52 Accounting $45,300 $74,900
53 Agriculture $38,500 $73,600
54 Microbiology $40,800 $73,400
55 Global & International Studies $39,600 $73,200
56 Urban Planning $41,100 $72,200
57 Nursing $55,400 $71,700
58 Environmental Science $41,300 $71,500
59 English Literature $40,800 $71,400
60 – tie Business Administration $43,500 $71,000
60 – tie History $39,700 $71,000
62 Film Production $38,200 $70,900
63 Biology $40,200 $70,800
64 Health Sciences $38,400 $70,500
65 Hotel Management $40,600 $69,800
66 Communication $40,000 $69,600
67 Forestry $40,000 $69,400
68 American Studies $41,400 $69,000
69 Broadcast Journalism $32,700 $68,800
70 Landscape Architecture $41,200 $68,700
71 Speech Communication $39,400 $68,100
72 Journalism $38,100 $67,700
73 Zoology $37,400 $67,600
74 Geography $40,800 $67,200
75 Public Administration $40,600 $66,900
76 French Language $40,900 $66,700
77 English Language $38,700 $65,200
78 German Language $41,400 $65,000
79 Human Resources (HR) $38,800 $63,900
80 Public Relations (PR) $37,400 $63,300
81 Hospitality & Tourism $35,700 $62,600
82 Humanities $37,900 $61,800
83 Anthropology $36,200 $61,400
84 Multimedia & Web Design $41,600 $61,300
85 Psychology $36,300 $60,700
86 – tie Medical Technology $48,900 $60,500
86 – tie Liberal Arts $36,600 $60,500
88 – tie Kinesiology $35,600 $60,400
88 – tie Visual Communications $37,300 $60,400
90 Organizational Management $41,900 $60,300
91 Interior Design $36,000 $59,300
92 – tie Nutrition $41,300 $59,100
92 – tie Fashion Merchandising $39,100 $59,100
94 Art History $36,900 $59,000
95 Sociology $37,400 $58,800
96 – tie Health Care Administration $39,300 $58,600
96 – tie Theater $36,200 $58,600
98 Criminal Justice $35,300 $58,400
99 Radio & Television $37,900 $58,300
100 Fine Arts $37,400 $58,200
101 Religious Studies $34,900 $57,900
102 Sports Medicine $39,300 $57,400
103 Art $36,100 $57,100
104 Classics $38,700 $57,000
105 Dietetics $44,200 $56,600
106 Public Health (PH) $35,900 $56,500
107 – tie Physical Education Teaching $34,900 $56,300
107 – tie Drama $35,600 $56,300
109 Graphic Design $37,000 $56,000
110 Photography $36,200 $55,500
111 Sports Management $37,000 $55,400
112 – tie Education $37,400 $55,200
112 – tie Animal Science $33,600 $55,200
114 Social Science $37,300 $54,800
115 Interdisciplinary Studies (IS) $37,600 $53,400
116 Paralegal Studies $35,000 $53,000
117 Theology $34,000 $52,200
118 Recreation & Leisure Studies $35,000 $51,900
119 Music $35,700 $51,400
120 Culinary Arts $34,800 $51,100
121 Exercise Science $32,600 $51,000
122 Horticulture $35,200 $50,900
123 Biblical Studies $35,400 $50,800
124 Special Education $33,800 $49,600
125 Human Development $35,900 $48,000
126 Athletic Training $34,800 $46,900
127 Social Work (SW) $33,000 $46,600
128 Elementary Education $32,200 $45,300
129 Child & Family Studies $30,300 $37,200

IRS Updates Key Tax Numbers For 2014

The IRS released its 2014 inflation adjustments yesterday. Some key takeaways:

· All tax brackets increased by ~1.7%, meaning that you’ll pay slightly less tax given the same amount of taxable income in 2014.

· The maximum allowed employee contribution to a 401k remains the same at $17,500 (+$5500 if over age 50)

· The total contribution to a 401k plan (employee + employer combined) increases from $51k to $52k.

· The maximum income allowed to be considered for defined contributions plan matches, profit sharing, etc. increased from $250k to $260k.

· The Standard Deduction amounts increased slightly to $6200 single (S), $12,400 married filing jointly (MFJ)

· The Personal Exemption increased to $3950 per family member from $3900.

· The Social Security Wage Base increased to $117,000 (this is the amount of your income that is subject to the 6.2% employer and employee social security tax).

· The Annual Gift Tax limit stayed the same at $14,000.

· The Lifetime Gift/Estate Tax Exemption increased to $5,340,000.

· The maximum allowed contribution to a Health Savings Account (HSA) increased to $3300 for single coverage, $6550 for more than one covered person.

· The Traditional IRA / Roth IRA contribution limits remained the same at $5500 (+$1000 additional if over age 50)

· The Roth IRA contribution income limits increased. The $5500 contribution begins to phase out at $114k and is eliminated completely at $129k of AGI for singles. It’s $181k and 191k for joint filers. Note, there still are no income limits on converting to a Roth IRA from a Traditional IRA.

· Itemized Deductions and Personal Exemptions begin to be limited if AGI exceeds $254,200 for singles and $305,050 for joint filers. Personal exemptions are reduced by 2% for every $2500 of AGI over that threshold. Itemized deductions are reduced by 3% of the amount that AGI is over that threshold.

· The income limits for being able to deduct up to $2500 of student loan interest start at $65k S and $130k MFJ. The deduction is completely phased out at $80k S and $160k MFJ.

· 2014 IRS Mileage Rate updates have not yet been released.

As always, you can find all tax brackets and key tax numbers listed on the Resources section of the PWA Website.

New Rule For Healthcare Flexible Spending Accounts

The IRS announced yesterday that it is relaxing the rules around the use-it-or-lose-it “feature” of healthcare flexible spending accounts (FSAs). Plan sponsors will now be able to all plan members to rollover up to $500 of unspent FSA dollars into the following year’s FSA. Currently, any money not used during the plan year would be forfeited, though most plans do have a grace period that allows until 3/15 of the following year to zero out balances before forfeiture. Starting with the 2013 calendar year, plan sponsors can now choose whether to:

  1. Implement the new $500 rollover rule OR
  2. Maintain the grace period rule that extends the deadline for using a year’s FSA funds until 3/15 of the following year OR
  3. Neither

It is up to the employer (plan sponsor) to set the rules for the given plan. Since 2013 is almost over and most plans already allow the grace period rule, I suspect few plans will be changed for the 2013 plan year to allow the new rule. It is possible that plans may be updated to the new $500 rollover rule for 2014. If you’re going through your Annual Benefits Enrollment, plan to use a healthcare FSA, and have not received any direction form your employer as to whether or not they plan to implement the new rule, please contact your HR representative and ask.

Full text for the rule change can be found in Notice 2013 -71 on the IRS Website.

DC Crisis Averted

I don’t usually like to call the result of a game before it’s over.  But in this case I’m confident saying that the deal reached in the Senate today, which does nothing other than re-open the government through 1/15/14 and extend the debt limit to around 2/7/14, is a done deal.  The Senate is expected to vote around 6pm tonight (80+ will vote yes) and the House will vote a few hours later (I’d guess at least 65% will vote yes).  The President will likely sign the bill tonight, reopening the government by morning.

The crisis that never really was a crisis has been averted, miraculously (HA!), one day from the reported deadline.  Fear-mongering, yet again, served no purpose other than ratings and scaring people into making terrible financial decisions.  As I’ve been saying all along, there was a 0% chance of default or any permanent damage to the economy that would result from it.  Minor, temporary damage has been done though shaking the confidence of businesses and consumers, but we’ll recover from that.  However, nothing has been done to pass a budget and make the country’s long-term fiscal situation sustainable.  Over the next 3 months, which will include time off for holidays, Congress has to make some progress, or we’ll be right back in the same situation again with another “crisis” to start 2014.  We’ll see what they come up with.

For now, back to business as usual with the hopes that the last few days don’t become the new business as usual.

***Update, 11pm eastern time***

Senate passed bill 81-19 (I predicted 80+).  House passed bill 285-144 (66.4% vs. my 65%+ prediction).  Obama to sign momentarily.  Government will be open in the morning.  Debt limit extended to 2/7.  25 hours to spare from their 10/17 deadline.  Congress is getting better at this!

Quick Update On Debt Ceiling

For those not following via Twitter, here’s what I posted today:

4pm: The storm before the calm is building in DC. Gotta take the country to the brink so they can be heroes in bringing it back.

4pm: I’d say we’re two plans away from having a plan to pass a bill that sets guidelines for developing a plan before the next deadline #cankick

7pm: Another failed plan in the House. I think we’re one away from real deal now (with little substance but will avert the “crisis”)

Still confident a deal will come right before it has to (and that’s not 10/17 as is being reported), and the US will not default on its debts.  As I’ve been saying, the result would be so catastrophic, that no one in Congress will let it go that far and the President / Treasury will use all possible measures to make sure it doesn’t happen.  Fitch ratings agency put the US on credit watch negative meaning there’s risk that they would downgrade the US Debt in the future.  Immediately after, the orchestrated response was released by Treasury explaining how Fitch’s actions demonstrate the gravity of the situation.  Everyone knows this will get resolved, but the fear-mongering will continue in the press for the next few days.

What happens beyond the agreement is a potential issue.  Further short-term agreements, followed by a “crisis”, a shutdown, a threat of default, and then a kicking of the can again in another short-term agreement, will cause a broad loss of confidence in the US government and financial system.  If we keep managing “crisis” to “crisis”, we will eventually be faced with a CRISIS.  We’re not there yet, but it’s not that far off if this continues.

If you’re not following via Twitter, I encourage you to do so as I’ll post short bursts of relevant news or a quick thought here and there.  @TomAtPWA.

US Debt Default

More political posturing today as President Obama and House Speaker John Boehner both had press conferences to say pretty much exactly what they’ve said for the past two weeks. They’re saying it louder and more sternly each time, giving it full grandstanding effect. Obama won’t negotiate unless Republicans pass a Continuing Resolution and raise the Debt Ceiling, which is like asking them to leave all their chips outside of the poker game. Boehner won’t allow a clean Continuing Resolution or Debt Ceiling bill to be voted on in the House, even though they would almost certainly pass, without some negotiation on spending reductions or Obamacare concessions attached to it. In other words, they have a complete standoff.

I expect more of the same for another week or so, but I don’t think the sands running out of the hourglass come with a proportional increase in the chance of a US debt default. Since there is virtually no chance that a resolution will be reached until the last minute (likely a few minutes after the last minute), the probability of non-resolution should not increase as time passes. Financial markets don’t believe there will be a debt default. Countries, companies, and individuals continue to lend money to the United States at absurdly low rates (essentially 0% for a year, 1.4% for 5 years, 2.6% for 10 years, and 3.7% for 30-years!!). The chart below shows credit default swaps (CDS) on five-year treasuries in basis points. CDS pay out in full in the event of a default. 41 basis points means that people are paying 41 cents for protection on $100 of treasuries implying a four tenths of one percent (e.g. negligible) chance of default over the next five years. While slightly elevated from a few weeks ago, 41 basis points is actually about the average over the last four years, and still substantially lower than the 65 basis points during the 2011 debt ceiling “crisis”. Today, even after the grandstanding, those same CDS actually traded down to 37 basis points.

I’m not worried about a default, just like financial markets aren’t worried about it. I’m not worried about 11:59pm on October 17th either, because that is not the exact moment that a debt default would happen if the Debt Ceiling isn’t raised (ironically, the govt. shutdown has slowed spending for the last week, so there should be a bit more wiggle room). I’m confident the debt ceiling will be raised just before it needs to be raised. I really only worry about self-fulfilling feedback loops that occur in a negative direction (like the death spiral that occurs when businesses layoff workers in mass which results in less spending in aggregate in the economy which results in lower profits which results in more layoffs). I don’t worry about those things that provide a self-regulating effect. In this case, any increase in the probability of default would lead to an increase in the probability of politicians being held directly responsible for another deep recession, which leads to the sudden ability to be rational, compromise, and save their future jobs.

The stock market will continue to be jittery as program trading, momentum trading, and day trading dominate day-to-day volume and direction of movement. I have full faith that there will be no default and no permanent damage to the economy. When that becomes certain, the economy in aggregate, the actions of the Federal Reserve, and the profitability of individual companies will once again dominate the way the market is valued. I’m not making any changes to client portfolios or asset allocation models in general as result of the debt ceiling / continuing resolution “crisis”. As the old proverb states, this too shall pass.

Obamacare Exchanges To Open 10/1

The healthcare exchanges that were created under the Affordable Care Act (more commonly known as “Obamacare”) are due to open tomorrow, October 1st, 2013. Through these exchanges, anyone who wants to purchase health insurance, should be able to purchase it from a health insurance company, with coverage to begin on 1/1/14. To access the exchanges and a host of additional information around how the exchanges will function, go to www.healthcare.gov. That portal will contains links to the Federal exchange as well as links to the State exchanges in the case that you live in one of the states that have set up their own exchange. The 36 states that will use the Federal exchange are: Alaska, Alabama, Arkansas, Arizona, Delaware, Florida, Georgia, Iowa, Idaho, Illinois, Indiana, Kansas, Louisiana, Maine, Michigan, Missouri, Mississippi, Montana, North Carolina, North Dakota, Nebraska, New Hampshire, New Jersey, New Mexico, Ohio, Oklahoma, Pennsylvania, South Carolina, South Dakota, Tennessee, Texas, Utah, Virginia, Wisconsin, West Virginia and Wyoming. All others, including Washington, D.C. will have their own exchange. The portal will guide you to the right place.

The exchanges will have plans grouped into the following 4 coverage tiers: Bronze, Silver, Gold, and Platinum. All plans must provide essential health coverage including prescriptions, preventive care, doctor visits, emergency services and hospitalization. The characteristics of each plan will fit the general model under one of these tiers so that those exchanges that have multiple insurers providing coverage can present apples-to-apples comparisons among those plans, but some insurers may offer additional coverage in certain areas (e.g. physical therapy). Bronze plans will generally be the lowest cost plan from a monthly premium perspective, but will be the highest cost from an out-of-pocket perspective if you need non-preventative care. Platinum plans are the opposite, with Silver and Gold fitting in between. You can expect a Bronze plan to cover about 60% of out-of-pocket costs after a deductible, Silver to cover 70% after a lower deductible, Gold to cover 80% after a still lower deductible, and Platinum to cover 90% after a low deductible.

The insurers themselves will provide a quote for the monthly cost of coverage based on some basic information that you provide. It’s important to note that pre-existing conditions are not a consideration for coverage or for the cost of coverage. There are a number of other government imposed rules, like not being able to charge older applicants an unreasonable amount more than younger applicants, that influence pricing. Of course the biggest influence, in theory, is that the insurers will be competing with each other for the business.

Once pricing for an applicant is determined, potential Federal subsidies could apply and reduce the cost of the monthly premiums. If you fall under 4x the Federal poverty level for the size of your family (~$46k for individuals + $16k per additional family member), you’ll usually qualify for a subsidy. You’ll have to estimate your income for the following year in order to receive the correct subsidy. If you estimate your income will allow you to qualify, but then your income is actually higher and you don’t qualify, this will be reconciled on your tax return and you will wind up paying back the subsidy amount. Kaiser has a calculator that can help estimate your subsidy.

On the other side of subsidies, those who opt not to purchase insurance and who are not covered by another plan (e.g. an employer-sponsored group plan), will face a penalty starting in 2014 at $95 or 1% of household income, whichever is higher. By 2016, it rises to $695 per individual or 2.5 percent of household income, whichever is greater. This is known as the “Individual Mandate”. The penalty will be paid as a tax when filing your tax return if you can’t prove that you have coverage.

In general, the exchanges will benefit those who are older, have income below the subsidy threshold, have pre-existing conditions, and/or don’t have employer-provided coverage. Most people fall into one of the following four groups as it pertains to health insurance, so I’ll divide the rest of this message accordingly. If you:

1) Have coverage through a large employer’s group plan – you are welcome to shop the exchanges for better or cheaper coverage, but are unlikely to find it. Large employer’s usually provide heavy subsidies for the cost of group insurance that makes that insurance cost less than the individual policies that you’ll find on the exchanges. Still, it doesn’t hurt to look and see what’s out there.

2) Have coverage through a small employer’s group plan or through your spouse’s or parent’s employer’s group plan – since small employers usually provide less of a subsidy for group plan, and many employers, regardless of size, provide less of a subsidy for spouses and dependents, the exchanges could provide a better option for you. Again, it doesn’t hurt to look and you might be surprised to find a better plan, especially is your income is below the subsidy threshold.

3) Have individual or family coverage that is purchased directly through an insurer (not a group plan) – you should definitely re-shop your insurance needs on the exchange. It’s similar to having a website that aggregates all auto insurance information for you so that you can compare between insurers. You’re likely to find a better deal than you’re getting today, especially if you’re over age 50 and have an income below the subsidy threshold. Note that there are no subsidies for individual or family policies that are purchased off-exchange.

4) Have no coverage – if you don’t have coverage because you have a pre-existing condition or because you can’t afford it, you’ll almost certainly benefit from the exchanges and should shop them during the open enrollment period. If you don’t have coverage because you have chosen not to have it, then you’ll need to compare the cost of the tax penalty for not having coverage with the cost of coverage you can obtain from the exchanges. While it may be cheaper to maintain no coverage and pay the tax penalty, when you consider the potentially catastrophic exposure to medical bills, I have to think you’re almost certainly better off with the insurance.

Again, www.healthcare.gov is the starting point for all of this. Expect a few technical glitches in the system over the first few days / weeks, but remember that coverage doesn’t start until 1/1/14 and open enrollment lasts until 3/31/14, and can be extended by certain life events after that date.

The Value Of Volatility

When the market falls, especially after a strong upward run (4+ years in this case), I think it’s worthwhile to remind everyone about the value of volatility. To keep it simple, let’s just think about a simple portfolio containing all US stocks and no bonds. This is what I would consider to be an extremely aggressive portfolio, one that would be hit very hard by a bear market like we had from late 2007 to 2009. Let’s look at 2 cases, with the stock index in both cases shown in the graph below:

Case 1: Reality (Volatile Market) – Using the actual performance of US Stocks from late 2007 to the end of 2012, suppose you had a $100k portfolio in September of 2007, just before stocks peaked and started heading lower. Your financial plan for retirement called for $1k per month contributions consistently (think of this as your 401k for example). The market tanks, losing almost 50 of its value by March 2009, and then slowly comes back to surpass where it started. By the end of 2012, you would have amassed a sum of $196,024.60. That’s your original $100k + $63k in contributions + over $33k in gains.

Case 2: “Ideal” (Market Never Falls) – In this case, we’ll pretend that the stock market moved in a slow straight line starting at the same value as in Case 1 and ending at the same value as in Case 1, but with no volatility. It never had a losing month and just kept slowly increasing. Let’s start with the same $100k and add the same $1k per month. This would feel much more comfortable. You could look at your statement and see constant progress… slow and steady. No sweating, no heartburn, no temptation to sell or alter your contributions. I call this the “ideal” case in quotes, but it’s actually far from ideal. In this scenario, you would have ended 2012 with $180,931.30. Again, your original $100k + $63k in contributions + ~$21k in gains. That’s only 2/3rds of the gain with the volatile portfolio, simply because you never get to add your $1k per month at lower prices.

The moral of the story here is that if you’re adding to your portfolio regularly, you really should be hoping for the market to fall from time to time, not rise, so that you can buy at lower prices. Sure, you want the market to rise right before you need to withdraw money, but until then, the lower it goes (a la March 2009), the worse it will feel, but the better it will be long-term. Volatility is the real “ideal” for the long-term investor.