Market Update – Greece & Dominos

It’s likely to be a volatile day tomorrow and potentially for the rest of the holiday shortened week in the stock market. A few hours ago, Greece announced that its banks will not open on Monday and that when they eventually open (maybe a week from tomorrow), they may impose “capital controls”, a.k.a. limits to how much anyone is able to withdraw from their account each day. The Greek government has been negotiating with the “Troika”, the European Commission, the International Monetary Fund and the European Central Bank (ECB), trying to get them to agree to provide continued emergency support to the banking system, new loans so that the Greeks can pay back other maturing loans, and improved terms on other existing loans to make it feasible for the Greeks to eventually pay those loans back in their entirety. In return, the Troika wants Greece to agree to raise taxes, implement an IRS-like tax-collection agency, and reduce spending (including cutting pensions and raising the retirement age from 61 to 67) so that it is more in line with its tax revenue and sustainable over the long term. If they can’t come to terms, Greece will default on its debts and lose support from the rest of Europe. They’ll also potentially be forced out of the Euro and back to their own currency. If an exit from the Euro happens, Greek Euro deposits will be converted to local currency (Drachmas most likely) which will have much less value. In advance of this, the Greek people have been pulling their Euro deposits out of banks so that they can retain their value in the case of a Euro exit. Since all banks are built on leverage (they loan out $10+ for every $1 they have for example since there’s no need to keep those deposits on reserve for withdrawals because the entire population does not want/need their cash at the same time in normal circumstances), consistent, massive withdrawals essentially cause the banks to run out of money. Even rumors that this could happen can be self-fulfilling and create the classic “run on the banks”. If the banks go down, so does the engine for the economy, which in Greece, is already struggling horribly. No more loans, no more deposits, no way to electronically move money, no way to cash checks, etc.

Negotiations between Greece and its creditors have broken down, with a $1.8 billion loan due to the IMF on Tuesday. A referendum is scheduled in Greece for July 5th, where the people will vote whether they’d rather accept austerity imposed by creditors in return for further assistance, or turn away from the rest of Europe and go at it on their own, likely with their own devalued currency which would work fine purchase and sale of goods made domestically, but would cause massive inflation in prices of anything imported. In the meantime the banks will be closed and the self-fulfilling bank run fears grow. If they reopen without support from the rest of Europe, including emergency liquidity provided by the ECB, they will be forced to institute capital controls and/or begin using a local currency. There simply is not enough money in Greek banks to satisfy the demands of the Greek people.

You may be thinking, “That’s a shame, but what does it have to do with me in the United States?” The problem is not with Greece, per se. Since most Greek debt is owned at this point by the ECB, any defaults can likely be absorbed rather than cause other foreign banks to have liquidity problems. However, if you lived in Spain, Italy, or Portugal, knowing your government is in a ton of debt as well (though not nearly as bad as Greece), has growing deficits, and is relying on the ECB to facilitate low borrowing costs, wouldn’t you start to think the Greek situation could be coming to your backyard someday soon? If there’s a chance that your government might close your banks and institute capital controls, wouldn’t you think twice about leaving your money at those banks? That is precisely the line of thinking that can start a bank run in those other European countries, well in advance of any debt default or exit from the euro. Could they too end up like Greece, lose the support of the ECB and the rest of Europe, and default on their debts? If so, the owners of their debts (which is not well-contained at the ECB as Greek debt is) will lose massive amounts of money. Many of those debt owners are US banks and that means dominos can begin to fall as they did in 2008 with mortgage defaults triggered the ultimate collapse of Lehman Brothers and the resulting seize-up in the US banking/credit system.

We don’t know whether Greece is the first domino in a set of tightly placed dominos that could all collapse if it does. We don’t know that the Greek domino will even fall (though it’s certainly looking like it right now). We also don’t know how much of this is already priced into the markets. The potential for Greek/Europe negotiations to break down has been well telegraphed. What we do know is that there are large players in the financial markets (e.g. hedge funds) that make bets on events like this. Those on the right side reap the rewards. Those on the wrong side typically have to sell lots of assets to cover the cost of their incorrect trade (which is typically leveraged multiple times over). The sale of assets pushes prices down globally, even if temporary, which causes other institutions to have to sell, and has the potential to create panic selling from institutions that have nothing to do with the issue and from retail investors.

My intent is not to scare you, but to keep you informed so that you’re not scared. My intent is not to try to predict what’s going to happen, or to tell you that we should move money around and try to time these events. Markets could fall horribly over the next few days and snap back. They could fall overnight tonight (futures opened down about 2% as I was writing this), and snap back by the time they open in the morning. They could rise dramatically if either there is a positive resolution in negotiations (because then the fears that are priced into the market were incorrect), or even if Greek banks do fail and it does exit the Euro as then there would be certainty for the first time in almost a decade as to the final resolution. They could also rise if more central bank (Fed, ECB, BOJ) stimulus comes as a result (the probability of a September Fed rate hike fell from 45% on Friday to 25% tonight according to Fed Fund Futures). There’s no way to predict what the stock market will do tomorrow (other than the fact that it’s indicated down 2% already), or this week, or this year or how the rest of the world economies and individual events will intertwine and influence those markets. These are the types of events that create the volatility and downside risk that ultimately enables the long-term market returns that the stock market provides. When you invest, you’re making a deal with yourself that you’re willing to ride a roller coaster of ups and downs in order to benefit from the long-term compound returns that come from those investments. We strongly believe that the stock market is THE primary place to be for your long-term investments, regardless of what may be happening at any point in time. We also strongly believe that the stock market is NOT THE primary place for money you need over the short-term, precisely because negative events can happen at any time. Cash emergency funds, conservative short-term investments, and long-term investments in the stock market mean you don’t need to worry about the short-term because that money isn’t primarily in the parts of the market that can fall sharply due to an event, and you don’t need to worry about the long-term because, by definition, it’s not impacted by those short-term events. I provide this as a reminder so that if the stock market falls and the mainstream news sources begin to call this the next “crisis” (i.e. they see the opportunity to fuel the fear fire in return for ratings), you’re one step ahead of the game, know what’s going on, and can stay focused on those things that are in your control. I’ll provide more updates as the situation progresses.

Q4 2014 & Calendar Year 2014 Returns By Asset Class

New highs in US Large Cap stocks did not follow through to many other asset classes in Q4 2014, largely because of currency shifts (US Dollar gains vs. virtually all other currencies which make foreign currency denominated investments worth less on a relative basis), lagging economic performance in Europe, and a sharp decline in energy prices (oil down over 40% in Q4 alone). The list bellow shows performance for a select set of asset classes using representative ETFs (or spot price in the case of a commodity) as a measure for each:

As always, I’ll provide the reminder that past performance is not indicative of future results and that long-term expected returns (used for planning purposes) remain unchanged.

Market Update 10/15/2014

I don’t have a crystal ball and can’t tell you where the market is going, but I can tell you why I think it has fallen recently. Here are my top pain points in reverse order of concern/impact over the short-term (#6 having the biggest impact in my opinion):

1) Geopolitical Tensions / Civil Unrest – press on these has eased recently just because there seems to be worse news in other areas to take the headlines, but they’re still very present. Middle East, Russia / Ukraine, Hong Kong… all these sorts of issues threaten global economic growth through lower productivity and inefficient use of resources. Protests, sanctions, wars, fear, and loss of life around the world that seems like it will be ongoing indefinitely.

2) Central Banks – the US Federal Reserve is ending Quantitative Easing (QE), their bond buying program that essentially amounted to printing money to purchase treasury bonds (finance government debt spending) and mortgage backed securities (finance home purchases). Many worry that the end of QE and the ultimate beginning of an interest-rate hike cycle will put the brakes on a recovering US economy. So far, long-term treasury rates and mortgage rates have stayed low despite the Fed pulling back on QE as a potential economic slowdown tends to lower rates on its own. Other major economies of the world are also moving in the opposite direction, embarking on further monetary stimulus programs as the US pulls back. This forces their rates lower and acts as competition for US rates, dragging them lower as well. 10-year government bonds in Germany are paying less than 0.7% right now. US ending monetary stimulus while Europe and Japan extend stimulus tends to push the US Dollar up vs. the Euro and the Yen, making our exports less competitive which can also act to slow down the US economy. As one of very few sources of global economic recovery for the last few years, a lot is riding on continued US growth and the end of QE combined with a stronger dollar jeopardize that.

3) Europe – the majority of the continent’s economy is still a disaster and there aren’t any signs of improvements. Many suspect a QE-like program launching in Europe soon, but the legalities of such a program in a common currency with so many different jurisdictions involved make it difficult to pull off. There’s also no way of knowing how it effective it would even be given how low interest rates in the Euro zone already are. Additionally, some concerns from a few years ago are roaring back. Greece wants to end its participation in its bailout program, but doing so means it won’t be able to borrow at the low euro-zone rates, and potentially means it will need to exit the Euro completely which threatens the stability of the currency as a whole. If Greece reverts to its issues of a few years back, Portugal, Spain, and Italy (maybe even France) can’t be far behind.

4) Oil – the price of oil has been plunging in the past few weeks. While this is good for global economic growth in general (lower prices at the pump, lower heating oil this winter, lower costs for airlines, etc.), a portion of the US recovery has been led by the energy sector and our progression toward oil independence from the Middle East though domestic production and Canadian imports. It appears that OPEC is putting on a sort-of price war now with the US, keeping their production high despite falling prices because their drilling costs are lower than our more complex ways of extracting oil (oil sands, fracking, etc.). If they can push the price down for long enough, they may be able to force a reduction in US / Canadian production and maybe even put some US / Canadian companies out of business which will ultimately push prices back up with a larger share of oil production coming from the Middle East again. As energy prices dramatically fall, hedge funds that are dedicated toward energy investments, sometimes in a leveraged way, are forced to liquidate which causes further drops in energy prices and ultimately in other assets as well. Forced selling begets forced selling and the price of everything tends to fall in a whoosh until leverage is managed, markets clear, and price stability resumes. If oil continues to fall, it’s likely the rest of the market will fall with it until oil stabilizes. The good news is that once the forced selling is done, we’ll be left with lower energy prices overall and as long as the US / Canadian producers survive, that will be a stimulus to the economy in additional discretionary money in the pockets of consumers.

5) Ebola – this is one of those very low probability of extreme catastrophe events that makes it very hard for financial markets to price risk. When markets can’t price risk, then tend to avoid it, and that means short-term traders selling just about everything other than the safest assets (treasuries). Ebola has been around for a long time and there have been other outbreaks. There will be other outbreaks after this as well, since it is carried by animals that can transmit the virus to humans, without illness by the animals. If contained, as it has been in the past, it will come and go again as any other flare up of disease (remember SARS?). If not controlled, given a 70% mortality rate with the latest outbreak, it threatens large sections of the population. The concept of confident long-term market growth is based on population growth and productivity increases over time. If a disease eliminates substantial portions of the population, that premise fails and even over the long-term, economies will shrink and equity markets will shrink with them. Even if the most likely scenario happens (a minor breakout with no epidemic-like results), fear of the disease can temporarily cause fear of being out in public, traveling, shopping, etc. Each time more negative ebola news comes out, stock markets take another leg down. With a 10-14 day incubation period, It could take several weeks to see that the breakout is controlled before some confidence is restored. As I write this, details have emerged about a 2nd healthcare worker in Dallas having ebola and having flown on a commercial jet the night before her symptoms began. Sure enough the market fell to new lows shortly after the news. The US CDC needs to instill confidence soon or ebola will take the economy down in the short-term (best case) and could take it down in the long-term if it truly does become an epidemic. Again, very low probability of extreme catastrophe, but until it’s a zero probability, it will have an impact in financial markets.

6) Fear / Self-Fulfillment – Fear of all of the above having a negative impact on the economy causes markets to fall which causes confidence to fall which causes spending to drop and layoffs to begin, which causes the economy to contract. It can be self-fulfilling and can happen very quickly. The more the stock market falls and the longer the fall drags on due to fear of a recession, the higher the potential that the recession occurs as a result. This is the biggest concern for the stock market short-term. This correction, so far, has happened quickly and hasn’t taken market levels to a point that the fall will impact the economy. That doesn’t stop the market from starting to worry about though.

Remember, markets tend to climb the wall of worry. As long as there are reasons to worry, there’s room for the market to go up. New worries will push it down temporarily (no one was talking about ebola a year ago), but the lower prices go, the better the price you get if you’re using a consistent plan of buying over time. This is why people are so successful with 401ks. Volatility creates wealth for those who don’t fear it (see https://blog.perpetualwealthadvisors.com/2013/06/20/the-value-of-volatility/). While we can’t control the aggregate market going through a fear-cycle, I hope that understanding the reasons that cause the fear helps you avoid it.

Perspective

The stock market has hit a rough patch over the last couple of months and that has intensified over the last couple of weeks… Just some quick charts on what’s happened since the March 2009 bottom in the stock market for perspective:

Seeing stocks pull back 10-20% from highs is completely normal from a historical perspective. It’s also not predictive of what will happen in the near term future. Stocks could go sharply lower from here, could flat line, or could snap back to new highs. The volatility inherent in stocks, especially over a short period of time, is the price you pay for the long-term expected returns that stocks have historically provided. Any equity investor has to be prepared to lose 50% of their portfolio’s equity holdings at any time in return for those long-term expected gains. As long as money that’s needed for the short-term isn’t primarily in stocks, losses on that money will be muted. For money that’s invested for the long-term, as long as it really isn’t needed until the long-term, short-term performance is not relevant (sign up for the roller-coaster when you invest and hang on during the ride).

After-Tax 401ks & Rollovers To Roth IRAs

The IRS recently clarified rules surrounding rollovers of qualified plans (401ks, 403bs, etc., all of which I’ll refer to as “401k”s for the rest of this post for simplicity) to IRAs which can have a dramatic impact on a plan participant’s ability to save for retirement in some situations. For those of you who want to read the official IRS notice, it is Notice 2014-54, released on September 18, 2014. For everyone else (which is probably everyone), I’ll summarize what changed and what it means for you. First some background…

Virtually everyone understands the pre-tax portion of a 401k. You defer a portion of your salary as a deposit to your 401k and that amount is not taxed in the period it’s earned. Instead, it grows tax-deferred until retirement, at which time you can withdraw it (usually after age 59 ½ without penalties) and pay tax at withdrawal. Another, newer type of 401k is a Roth 401k. In a Roth 401k, you are taxed on the income that you defer to your 401k, but it grows tax free and is not taxed at all (under current laws) at withdrawal in retirement. If your tax rate is the same at the time of deferral as it is in retirement, then both types of 401ks produce the same amount of after-tax money in retirement. For most people who are into their mid-earning years, the premise that they’ll earn less in retirement and have more ability to control what portion of their retirement savings is subject to tax each year means they’ll probably be in a lower tax rate in retirement. This means they’d favor the pre-tax “Traditional” 401k. While the generalization is true, in general, like much of financial planning, the details of choosing between a Traditional 401k and a Roth 401k are complicated and really need to be evaluated on a case-by-case basis. Regardless of whether you contribute to a Traditional 401k, a Roth 401k, or a combination of the two, the IRS limits contributions at $17,500 per year (indexed to inflation and likely to increase to $18,000 for 2015) + $5,500 more if you’re over age 50. If your employer makes contributions to your 401k via matching, profit sharing, or direct contributions, a second limit applies. That is that your contributions plus your employer’s contributions cannot exceed $52,000 for 2014 (again indexed to inflation).

In addition to the Traditional and Roth 401ks, there is less well-known and less-popular type of 401k called the After-Tax 401k. Many plans do not allow an After-Tax 401k due to the difficulty in accounting for so many types of contributions. For those that do allow it, in this type of 401k, contributions are taxed in the year you earn them (they don’t go into the account pre-tax like a Traditional 401k), but at withdrawal in retirement, you only pay tax on the growth since you’ve already paid tax on the amounts you contributed. This is much less powerful from a tax perspective than pre-tax in (Traditional 401k) or tax-free out (Roth 401k), but is still advantageous in some cases because it means the growth (interest, dividends, and gains) is not taxed each year as it is earned and so that growth can continue to compound tax-deferred until withdrawal. The After-Tax 401k is not subject to the $17,500 employee contribution limit, but is subject to the $52,000 total contribution limit. This means that if you’re maxing out your Traditional/Roth 401k, and your employer isn’t contributing $34,500, and your plan allows an After-Tax 401k, there is room for you to contribute to your After-Tax 401k. Unfortunately, the tax on the growth of an After-Tax 401k is assessed at ordinary income tax rates rather than at lower, capital gain rates as an ordinary taxable brokerage account would be taxed. So, in general, an efficiently managed taxable brokerage can be a better option than an After-Tax 401k, especially when considering the liquidity advantage that comes with being able to access your money at any point for any purpose. This has been the root cause of the limited popularity and use of an After-Tax 401k.

Once you leave your employer, you can withdraw from your 401k and rollover the money to an IRA. Traditional 401ks go to Traditional IRAs and Roth 401ks go to Roth IRAs, all preserving their tax status. With After-Tax 401ks, it’s more complicated. If After-Tax 401k money is rolled over to a Traditional IRA, a portion of the Traditional IRA becomes “basis”, which is not taxed again at withdrawal and every withdrawal will be part growth (taxed) and part return of basis (not-taxed). If it’s rolled over to a Roth IRA though, the tax treatment used to be unclear. Many tax practitioners and plan administrators thought that the IRS would consider Traditional 401k money and After-Tax 401k money together in one rollover, assessing a prorated amount of tax if one were to try to roll pre-tax money to a Traditional IRA and after-tax to a Roth. This treatment would be consistent with the way the IRS taxes conversions from Traditional IRAs to Roth IRAs. If there are both pre-tax and after-tax (basis) dollars in a Traditional IRA, and you attempt to convert a portion of that Traditional IRA to a Roth IRA, you’d be taxed pro-rata on the amount. Others came up with complicated multi-step schemes to try to isolate the After-Tax portion of a 401k in its own account, such that it could be converted to a Roth tax-free. IRS guidance on Sep 18 clarified that effective immediately, After-Tax 401k dollars can be rolled over directly to a Roth IRA without any tax being due as long as it’s done at the same time as Traditional 401k money is rolled over to a Traditional IRA.

I find it hard to believe that this treatment will be around forever, but at least for now, this has opened the door for massive amounts of money to be tucked away in an After-Tax 401k and then rolled directly to a Roth IRA at the time service with that employer is terminated. Here’s an example of how it could work for someone earning $200k per year, maxing out her Traditional 401k with an 8.75% ($17,500) contribution, receiving a 3% ($6,000) employer contribution, and working for three years before moving on to another opportunity at a different employer:


20141007-BlogPic

The person above would be able to stash away $85,500 in a Roth IRA after only 3 years while otherwise earning too much per year to be able to directly contribute to a Roth IRA. It’s clearly not for everyone since you need to have a lot of free cash flow in order to take advantage of the large contributions and your plan needs to include After-Tax 401k contributions as an option. If it can work for you, and you’re looking to tuck away large amounts of tax-advantaged money, this is a really big deal.

So here’s what to do: If you’re maxing out your $17,500 401k contribution each year and looking to put more than that away for retirement, send your 401k plan administrator a note (or call) and ask, “Does my 401k plan allow after-tax (non-Roth) contributions after I’ve hit my $17,500 maximum pre-tax contribution each year?” If the answer is “yes”, you can start to take advantage of this immediately.

One final note to keep in mind… tax rules are always changing. There’s nothing to say the IRS won’t change its mind or that Congress won’t pass a law to stop this treatment of After-Tax 401ks. That’s true of any tax law or IRS interpretation of that law. It’s prudent to monitor the tax landscape and adjust decisions accordingly. Contact your financial advisor before and while attempting something like this or if you have questions about it.

Misleading Markets

While the Dow and S&P 500 have done fairly well this year and have held up decently so far this quarter, other asset classes that aren’t in the headlines, but are part of a well-diversified portfolio, have fared far worse. Some classes, like Commodities and Microcap Stocks have even fallen enough to be considered in a “correction” by its classical definition (10% down from highs). The table below shows (through 9/22) year-to-date and quarter-to-date returns for a select group of ETFs that represent major asset classes, along with their decline from their high over the last 52 weeks.

There’s no way to know whether this divergence in returns is predictive of poor returns to come, or if a reversion to the mean is more likely which would have underperforming asset classes begin to outperform. I just wanted to quickly point out that while the perception is that the market is at all-time-highs, this is really only true if you’re looking at US Large Cap Stocks in isolation.

Market Update – End of Q2 2014

There’s an old saying on Wall Street that markets tend to climb a wall of worry. That couldn’t be more true over the last few years. Whether it’s our own political and fiscal dysfunction, high unemployment, geopolitical tensions in the middle east, a debt crisis in Europe, slowing growth in emerging markets like China, the old “too much too fast” theory on stock market gains, the Federal Reserve and other central banks printing money, the potential end of that money printing, etc., there has been no shortage of reasons to worry the next correction cometh soon. Yet the stock market, as it usually does, makes a fool of those who try to predict it’s short-term behavior, and continues to climb that wall of worry. There is also no shortage of stock market prognosticators. Despite natural instincts to attempt to join them, I avoid it wherever possible and help clients design a plan that will be successful regardless of what the stock market does over the short-term. We don’t have to predict the short-term movements of the stock market in order to invest money toward particular financial goals. We simply have to keep money that’s necessary for short-term goals, predominantly out of the stock market!

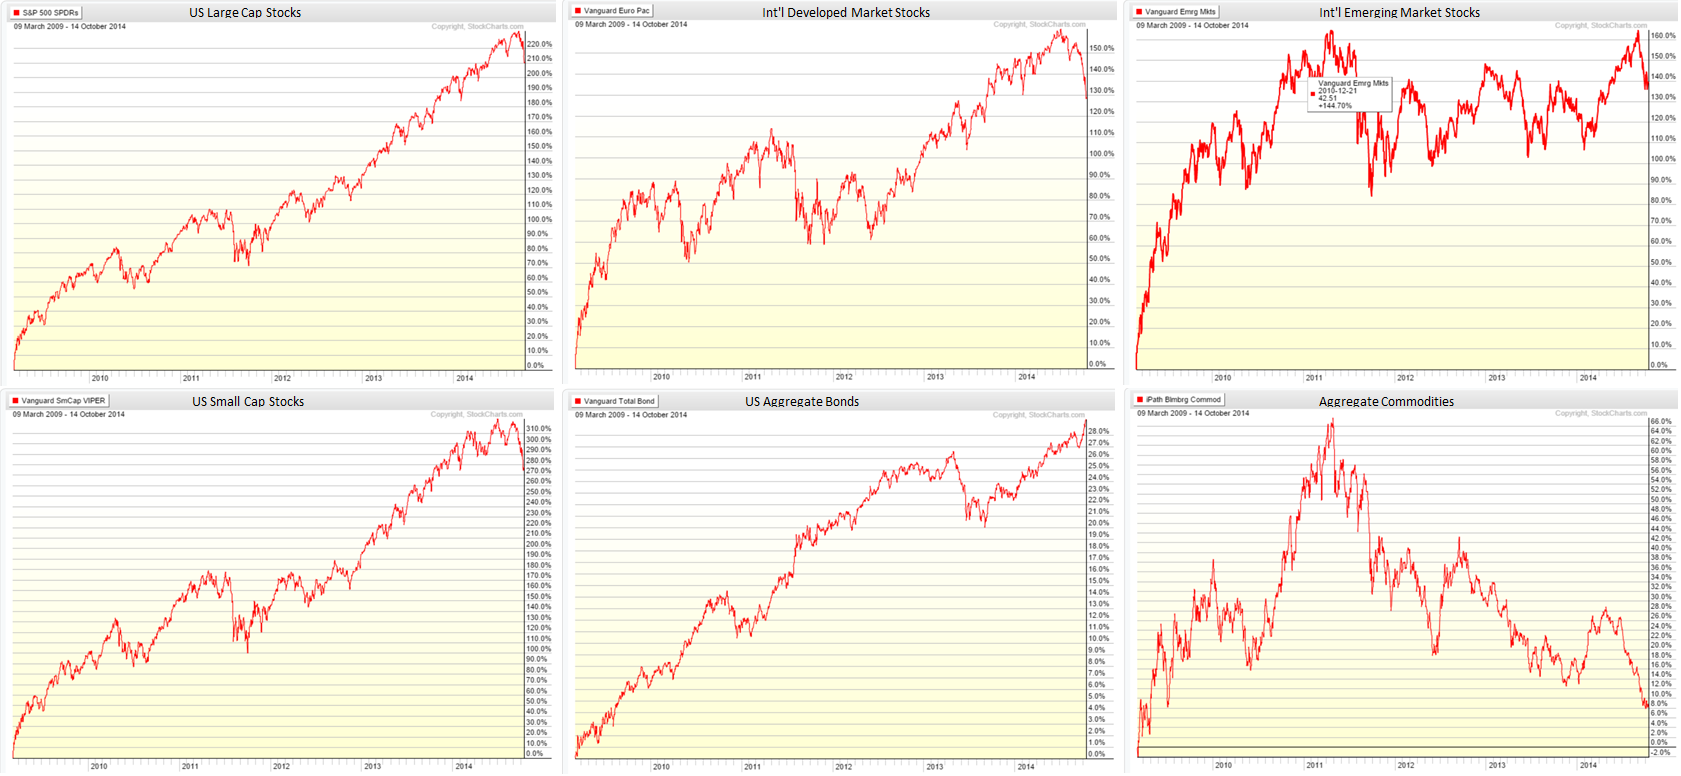
As strongly as I feel that trying to predict market movements is a fools game, I do think it’s possible and necessary to present a rational explanation for what the stock market has done in the recent past. This is to help clients past the natural fears that prevent them from sticking to their plan at times like 2009 (and for some, even now because of a feeling that the market is “too high”). It’s also to help clients past the natural greed that can develop when you see cash earning nothing for years while the stock market gains 200%. I believe that those gains came as part of a recovery cycle from very depressed levels, spurred on by the actions of the Federal Reserve and other central banks around the world. Those actions (low short-term interest rates, quantitative easing or “QE”, and forward guidance in the form of promised low rates for an extended amount of time) allowed the recovery cycle to take place in an environment that could otherwise have taken decades. I think of the recovery in four phases of realization that impart increasing and self-reinforcing confidence in the economy and financial markets. I describe them in more detail below, but for those without the time/desire to read that detail, they run from 1) “the world is not ending”, 2) “we’re growing again, but only because of the Fed”, 3) “interest rates are absurdly low and won’t stay that way for long” to 4) “we’re growing and interest rates are staying low even as the Fed pulls back”. With each realization, the stock market has made a move higher. The phases, in more detail:

· Pre-Recovery: Markets plunging, unemployment soaring, Lehman default, credit markets seizing up… I described the aggregate psychology of the markets during this period as beginning to price in the potential for the end of the financial world.

· Recovery Phase 1: Fed starts ZIRP (zero interest rate policy) and QE (quantitative easing). Unemployment peaks. Stock market bottoms. On 3/24/09, I wrote about QE as a “game changer”, just after that bottom. I’d describe the psychology of this period as pricing out the potential for the end of the financial world. The stock market in March of 2009 had essentially fallen 60% from peak in October 2007. Earnings estimates for S&P 500 companies for the next 12 months had fallen from over $100 per share at peak to ~$60 per share. At the same time, fear in the markets led to PE contraction and the S&P 500 PE fell to just over 10 (for more on PE and market valuation, please see this recent blog post). I remember discussing this with a colleague and stating that “applying a trough multiple to trough earnings is a trough in intelligence.” When earnings fall and have a massive path of recovery in sight (growth back to peak earnings over the next several years), PEs should expand to reflect that, not contract. This is exactly what happened. Over just a few months, PEs expanded back to their market average around 15-16 as the S&P 500 gained 50% from bottom with little change in future earnings estimates.

· Recovery Phase 2: Over the next few years, the Fed continues QE and adds its guidance that rates will stay low for an extended period. The economy begins to grow again, slowly. Job creation picks up to slightly above the level of population growth. Unemployment slowly begins to fall. The stock market continues to climb, but now due to increases in earnings due to a growing economy. At the same time, the unsatisfyingly slow growth weighs on confidence and though earnings are expanding, PEs begin to fall again on concerns for future growth.

· Recovery Phase 3: The Fed launches its new open-ended QE program, called “QE Infinity” by some (see Monetary Bazooka Fired). The Fed promises to keep rates low even longer (first through 2015, then till unemployment falls to a threshold, then beyond that). Interest rates plunge to historical lows as a result of QE and the Fed’s promise. The economy still grows slowly, job creation is still slow, and unemployment continues to fall slowly. Confidence seems a bit higher in the economy and in the Fed’s ability to create a no-lose situation. PEs expand again along with growing earnings and the stock market makes another strong move higher. This time though, I think the reason for the PE expansion is the promise of lower long-term rates for a very long time. We see dividend-paying stocks like utilities and REITs due extremely well in this environment because low interest rates makes their high dividends seem even more valuable. The economic recovery still doesn’t seem to have reached self-sufficiency though with the Fed still pushing it. What happens when the training wheels come off the bike and it has to pedal on its own? In phase 3, that was the market’s biggest worry.

· Recovery Phase 4: The Fed announces the tapering of its QE program, slowing bond purchases with hope of ending the program by late 2014. Markets hiccup on fear that this marks the beginning of the end for low rates. Rates begin to increase, PEs contract, and the stock market dips into the summer of 2013. The Fed reacts by strengthening its resolve to keep rates low well beyond the end of QE. Into early 2014 as the Fed continues to cut back on QE, Europe and Japan embark on monetary easing programs (Japan is in a massive QE program already and Europe begins to hint at one to come). European interest rates, even those for fiscally troubled countries like Italy and Spain plunge to levels that approach US interest rates because of growing confidence that the European Central Bank (ECB) will do anything and everything to make sure those countries don’t default. If Italy’s 10-year treasury yields 3% and the US 10-year treasury (thought to be much much safer than Italy’s bonds) yields 3%, that puts a cap on how much US interest rates can rise. Now, in mid-2014, even though the Fed is almost done with QE, the fear of rapidly rising rates remains in check due to central bank actions overseas. If rates are going to continue to remain low long-term because of those actions, then PEs should expand again to reflect that. Additionally, confidence that the economy won’t falter as rates rise takes hold. Housing can continue to recover. Employers can hire and plan for growth. Consumers can spend without worry of erosion in the jobs market. This is precisely what has happened over the past few months as unemployment has taken another dip down and job creation has picked up sharply. PEs have expanded back out to 15-16 on the S&P 500 (based on next 12 month’s earnings), right at their historical average. The recovery now appears closer to being self-sustaining, or at least is no longer dependent on the Fed’s QE (might still be dependent on Europe and Japan though).

That brings us to present day. Can self-sustaining (or ECB induced) economic growth increase earnings enough to push the stock market higher? Can the expectation of low interest rates for the foreseeable future push PEs above historic averages thereby pushing the stock market higher? Could both happen and really put upward pressure on the market without a spike in inflation? I believe this latest run up in stocks has come from more and more belief that the answer to all of those questions can be “yes”. This, in my opinion, is where the danger lies. If the market starts to price in “yes” answers, but the economy falters and earnings estimates turn out to be too high, or the ECB doesn’t go as far as everyone is expecting, or inflation starts to rear its ugly head and interest rates start to rise, putting pressure on PEs, we could be in for that correction everyone has been expecting for the last 5 years and 200% of gains. Remember, when the wall of worry disappears, stocks may no longer have anything to climb. So, there are lots of reasons to be positive and lots of reasons to worry about being positive. Again, I can’t predict the future, but I do hope my interpretation of why stocks have climbed 200% in 5 years helps you see that we’re not living in a world of irrational exuberance. I also hope my warnings of what could go wrong in the future can keep the greed-monster in check. Stocks are not massively over-valued, nor are they under-valued (S&P 500 PE is 15.55 at the time of this writing, which right about the historical average). There are pockets of stocks that seem very expensive (small cap growth companies, especially in the social media and cloud space), but not the market overall. Stocks have merely recovered from insanely low valuations, have reflected the growth in earnings in recent years, and have adjusted to a new level of long-term interest rates. While corporate margins are at the typical cycle highs, there is still room for revenue expansion if the economy as a whole picks up. We just need to be careful not to count on sharply rising earnings before they occur and not to price in very low long-term rates forever (forever is a very long-time).

This brings me to a related and important point. A few of you have asked in recent months for my stance on what I would do in an insanely and clearly overvalued stock market situation. If such a situation was to present itself (and seeing it might be like trying to drive around a corner while looking in the rear view mirror), I’m prepared to move models to a more conservative allocation and wait for the economy to catch up to the stock market. I’m not saying that evidence will always present itself before the market falls (it would be atypical if it did). I’m not saying we’ll ever move to “all cash” or “all in” at any point regardless of the evidence. I am saying that in an extremely overvalued situation, expectations of future returns will be lower, but risk will be higher. If that’s overwhelmingly clear, it would make sense to reduce risk temporarily, as a matter of prudence, not as a prediction of an impending market disaster. I have been close to doing this a few times in the past, but have a high tolerance when it comes to “overwhelmingly clear”, and so I didn’t act. Doing so would have missed at least a period of one of the biggest bull markets in history. Making such a move, even a small one, is not something I’d take lightly (especially with tax complications in mind that can offset any benefit to being right). If I ever do decide to take this step, I will communicate further on how it will be implemented and of course give all clients the opportunity to ask any questions and express any concerns. What I think is far more important than worrying about this sort of situation is making sure that your asset allocation is reasonable for your financial goals, that you can handle the downside risk without being scared when that risk becomes a reality, and that the upside returns target the returns you need to achieve your goals. Along those lines, after bashing stock market predictions earlier in this message, I’ll end it with two of my own. First, sometime in the next 50 years, the stock market is going to lose at least half of its value over a very short period of time. It might have started yesterday. It might start two decades from now. But, it’s inevitably going to happen. Don’t let the good times lure you into risking money you can’t afford to risk in the stock market. We use bonds and other asset classes for short-term goals because of their safety. We use cash for emergency funds because of the liquidity it provides. We can target an overall asset allocation that gives the best chance of hitting your goals regardless of what the stock market does, but we can’t be greedy and gamble for high returns over the short-term. Second, unless the world comes to a brutal end in some cataclysmic event that would make money useless anyway, the stock market will be much higher 50 years from now than it is today. A dollar invested in the S&P 500 in 1963 would be worth $116 today. That’s despite losing 10% in 1966, more than 42% in 1973-74, almost 50% from late 2000 to early 2003, and almost 60% from late 2007 to early 2009. Amazingly, even a dollar invested at the peak in Oct 2007 would be worth $1.47 today, almost a 50% return. Don’t let fear of the market falling tomorrow stop you from investing for the long-term today. There is no upside to hoarding cash, especially when it earns less than the rate of inflation like it does today. Stick to your plan in the good times and the bad, and always remember that there will be more of both in the future.

PE Ratios, Earnings Yield, Interest Rates, & Valuation

Many of you understand one of the most basic concepts in investments, the P/E ratio. For those who don’t, I’ll give you a brief explanation because you’ll hear “P/E” in almost any discussion on market or company valuation. “P/E” stand for Price-to-Earnings. It’s a ratio of what it costs to own a share of stock in a company, versus the annual earnings of the company that are attributable to that one share. In other words, PE = stock price ÷ annual profit per share. Annual profit is usually referred to as “Earnings Per Share” or “EPS”, so we can simplify a bit and say that PE = stock price ÷ EPS. It’s a measure of how expensive a stock is, relative to the earnings that one share of the company represents. For example, let’s take a look at Apple. The stock is trading at $92 per share. In the year ending Sep 2014, Apple is forecast to earn $6.88 per share (that’s about $41 Billion in profits divided by about 6 Billion shares outstanding). Thus, the PE for Apple is 92/6.88 = 13.37. Is that high or low? How do you determine a fair PE for a company?

To answer that, I like to take the mystery and complication of the stock market out of play and think about a small business, something that you can probably relate to a lot easier. Let’s say you and four friends start a business that earns a steady $50k per year in net profits. When you started the company, you decided you’d each own an equal 20% of the company. In case one of you wanted to sell a part of your share to someone else, you decided you’d each own 200 shares of a 1000 share total (still 20% of the company). If the company earns $50k per year, and there are 1000 shares outstanding, how much does each share of company earn? $50. That is, the EPS for your company is $50. Now, how much is your company worth (how much would someone being willing to pay for one share of your company)? Surely it’s more than $50k ($50 per share) right, because it’s earning $50k per year consistently, so someone who paid only $50 per share for it would get their money back in just a year. You would be highly unlikely to sell a share for such a low price… you’d just keep the share and earn the $50 over the next 12 months from profits instead. On the other hand, the company can’t be worth a billion dollars ($1 million per share), because even though someone paying $1M per share will eventually get their money back by earning $50 per year, 1) it would take several lifetimes, 2) there’s more risk that something happens to the business to reduce its earnings when you need to go farther out in the future to make back your investment, and 3) (most importantly) that $1M can be invested in something else that pays well north of $50 per year so no one would ever pay a million dollars for $50 per year even if it was guaranteed forever. Somewhere in between $50 and $1M per share there is a fair price though. Perhaps the best way to estimate is by using the third rationale above… how much money do I need to invest to earn $50 per year on something with a similar amount of risk? I can put $7700 in a 1-year CD and earn $50 at 0.65% interest. Clearly though, buying future profits of a business is higher risk than a CD so a buyer would want to earn more than the going rate for a CD. There’s also the chance that a buyer may not be able to re-sell the business in a year, so we should look at something that locks up money for a longer time period to compare. How about a 10-year investment-grade (BBB) rated corporate bond? That pays about 5% and has some real risk in it (the company could go bankrupt within 10 years and you wouldn’t get your money back). It would take a $1000 investment in that bond to earn $50 per year. There’s probably still more risk in the small business though because the only way you wouldn’t get your money back in a bond is if the company literally has no money and is forced to liquidate or file bankruptcy. In the small business, even if it just starts to breakeven for a while, there are no profits for the owners, so you may never get your money back. A buyer could argue that she would want a 5% higher return on an investment in your company than he/she could get from the corporate bond. The buyer would be willing to pay $500 per share then, since a 10% annual return on $500 is the $50 per share that your company is generating. $500 per share then might be a fair price for the business. A $500 price for a company earning $50 per year means a PE of 10.

What if your company was growing rapidly and your earnings were expected to increase considerably over the next few years? If $500 (PE of 10) was a fair price for a stable company, surely a buyer would be willing to pay more than $500 (higher than a PE of 10) for a rapidly growing company right? Of course, because he’s not only going to get just $50 per year, he’s going to get $50 this year and more than $50 next year and much more than $50 the year after that. That has to be worth more than the stable company that’s not growing. So now we know that PE’s should be higher for higher growth companies. This should seem pretty intuitive.

There’s another factor that can have a dramatic impact in a fair PE. What happens if interest rates fall and investment grade bonds start to pay 3.33% instead of the original 5%? If investors in a small business like yours still demand a 5% premium to what corporate bonds are paying, they’ll want an 8.33% return from an investment in your company. Since the company is still generating its consistent $50 per share per year, the only way to make that seem like a lower return is to push the value of the company higher. At $600 per share, the $50 in annual profits would be an 8.33% return. The reduction in interest rates pushed the PE (600/50 = 12) higher. So, we can generalize that lower interest rates lead to higher PEs. This may be less intuitive, so I’ll give another way of thinking about it. Instead of looking at the PE ratio, let’s look at its reciprocal. That’s the EPS / stock price. We can call this the “earnings yield”. For our small business above, the earnings yield would be 10% if the stock price was $500 (50/500), it would be 8.33% if the stock price was $600 (50/600) and it would be 5% if the stock price was $1000 (50/1000). If you could get 5% in a savings account or CD, would you ever purchase a company with a 5% earnings yield (remember, steady payments, not expected to grow)? I hope your answer is no, because there’s a lot more risk in the company than there would be in a savings account. So, if bank interest rates were 5%, there’s no way the small business could be worth $1000 per share (5% earnings yield, PE = 20). The price must be < $1000 per share. What if bank interest rates were only 1%? Now you might be willing to take 5% earnings yield in a riskier investment because you’re getting an extra 4% return over what you’d get in the bank. It should seem clearer that lower interest rates in general would make lower earnings yields seem more attractive. If lower rates lead to lower earnings yields, the lower rates must lead to higher PEs, because PE is just the reciprocal of earnings yield.

To summarize, remember that the P/E ratio is the price of a share divided by earnings per share. The reciprocal of the P/E ratio is earnings per share divided by share price and that’s called the “earnings yield”. The stronger the expected growth in earnings, the higher the P/E. The lower the level of overall interest rates, the lower the earnings yield, and the higher the P/E.

Withholding On Bonuses & Other Supplemental Wages

When you receive a bonus from your employer, have restricted stock vest, have taxes collected on the cashless exercise of a stock option, or receive any other form of supplemental wages, you may have too much or too little tax withheld depending on your marginal tax bracket and the method your employer uses for tax withholding. On a normal (non-bonus paycheck), payroll withholding tables take the amount of taxable income you earn for the pay period and translate that to the amount of tax that should be withheld, using the marginal tax brackets for your filing status (from your W-4), the number of allowances you claim (from your W-4), and number of pay periods in a year. For example, if you claim “Single, with 0 allowances”, you earn $8k in a pay period, and you are paid bi-weekly (26 x per year), the withholding tables will determine the projected annual tax liability based on the Single tax brackets, $8,000 * 26 = $208,000 of projected taxable income for the year. Dividing by 26 gives the Federal withholding amount for the pay period.

From the example above, you should be able to see how wildly the withholding rate can vary if your paycheck varies from period to period, which is why it is so hard to accurately set your withholding and why you never seem to get the same refund or owe the same amount year after year. (Add in exemptions, deductions, and credits, and it gets even more difficult). If you receive bonus pay as part of your regular pay, your employer can combine the two and determine the withholding on that paycheck based on the extrapolated annual income if you earned that amount each pay period. In this case, your projected annual income and the withholding tax rate will be very high because 26 * your combined wage and bonus is a very large number. You’d therefore have more withholding than is necessary for the period and would accumulate that amount toward a tax refund when you file. The more typical scenario is that your bonus would be paid either as a separate paycheck, or as a separate line item on your regular paycheck but considered as supplemental wages. In both of these cases, a statutory 25% withholding rate is used for the supplemental wages. If your marginal tax bracket is actually higher than 25% (taxable income over about $90k as a single filer, or over $150k as a married couple), then you’d have less withholding than is necessary for the period. That would accumulate toward an amount you’d owe when you file your taxes. In an extreme example, let’s say that you earn $250k per year as a single filer (33% tax bracket), but that you have an windfall of an additional $250k (bonus, stock, whatever). That $250k windfall is taxed at 25% when it should be taxed at ~35%, meaning you’d stand to owe $25k in tax when you file for that tax year.

The moral of the story is to be careful whenever you receive a bonus (or earn some other form of supplemental income like vesting equity). If the following conditions exist, it may cause you owe a substantial amount of tax at the end of the year:

1) It is paid in a separate paycheck, as supplemental wages on your normal paycheck, or withheld automatically as part of an equity transaction

2) You earn more than $90k per year (single) or $150k per year married, including the bonus payment.

Note that the tax is the same whether it is appropriately withheld at the time of the bonus payment or if you pay it at the end of the year. The problem isn’t that you pay additional tax. The potential problem is that you may owe a lot of tax and may not have been prepared for it (e.g. you used the bonus for a downpayment on a house or to payoff debt, and don’t have the cash remaining to pay your tax). It’s always a good idea to keep 10-15% of your gross bonus tucked away to make sure you have it available for taxes if needed. If you need a more detailed estimate of the potential tax impact of a large bonus payment, contact your financial advisor.