There have been a group of provisions in the tax code that have been expiring every year or two, forcing Congress to pass last-minute laws each December to prevent them from expiring. Yesterday, the Ways & Means Committee in the House came to terms on a deal to handle these “tax extenders”, which includes making some permanent and ending the year-to-year uncertainty. It is widely expected to pass the House & Senate and become law. Here’s a brief description of what’s included in The Protecting Americans from Tax Hikes (PATH) Act Of 2015:
- State & Local Sale Tax Deduction – Taxpayers who itemize can choose to deduct either their income taxes paid to states, or their sales taxes paid to states. Residents of states that have no income tax (and who don’t travel for work) use the sales tax deduction. The ability to deduct sales taxes ended in 2014 and is retroactively made permanent starting in 2015 by PATH.
- Teacher Expense Deduction – Up to $250 “above-the-line” (you don’t have to itemize to take it) deduction for teachers who purchase school supplies out-of-pocket and are not reimbursed. This provision would have ended in 2015, but PATH will make it permanent.
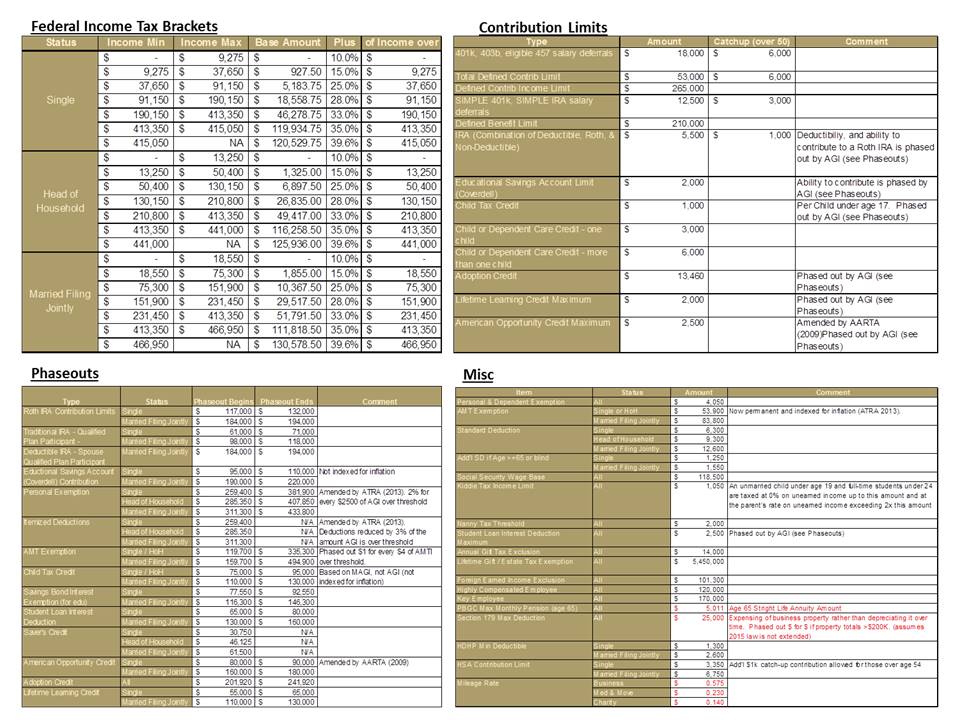
- American Opportunity Credit – Credit for up to $2500 per year of the first four years of post-secondary education (subject to income limits). This was scheduled to lapse after 2017 and revert back to the old Hope Scholarship Credit but is instead made permanent by PATH.
- Deduction For Qualified Tuition & Fees – “Above-the-line” deduction for up to $4k of college tuition/fess (subject to income limits), but can’t be used in the same year as the American Opportunity Credit. This provision ended in 2014 and is retroactively extended for 2015 and 2016 by PATH.
- 529 Plan Eligible Expenses – PATH now allows college 529 plans to pay for computers and related expenses in addition to the previous tuition, room, and board.
- Qualified Charitable Distributions (QCD) – Taxpayers over age 70 ½ can make up to $100k of charitable contributions per year, directly from an IRA, without treating the IRA distribution as income. It can also satisfy part or all of a Required Minimum Distribution (RMD). This provision ended in 2014 and is retroactively made permanent starting in 2015 by PATH.
- Discharged Mortgage Debt Exclusion – Allows discharged mortgage debt on a principal residence (via short-sale, foreclosure, bankruptcy) to be excluded from income. This provision ended in 2014 and is retroactively extended for 2015 and 2016 by PATH.
- Mortgage Insurance Premium Deduction – Allows a deduction (subject to income limits) for amounts paid for mortgage insurance (PMI, etc.). This provision ended in 2014 and is retroactively extended for 2015 and 2016 by PATH.
- Immediate Expensing Of Purchases – “Section 179” expensing allows up to $500k of asset purchases (phased out after $2M of total purchases) to be immediately deducted in the year of purchase instead of being depreciated over the life of the property. This provision was due to revert back to a $25k max per year phasing out if purchased property exceeded $200k in 2015, but is now retroactively extended, made permanent, and indexed to inflation by PATH.
- Bonus Depreciation – For purchases that don’t qualify for Section 179 expensing (or when Section 179 expensing is not elected), bonus depreciation allows 50% of the purchase price to be depreciated in the year of purchase. This provision lapsed at the end of 2014, but PATH retroactively brings it back for 2015 and maintains it through 2017. In 2018, the bonus drops to 40% and in 2019 it drops to 30% before expiring again for 2020.
[Edit 12/18/2015 :
- Solar Energy Credit – The 30% residential solar credit that was supposed to expire in 2016 will apply through 2019 and then phase out until it expires in 2022.