Q2 2016 Returns By Asset Class

The link below shows Q2 2016 returns by asset class (by representative ETF), as well as year-to-date, last twelve months, and last five years.

Asset Class Returns

While I don’t think there is any predictive power in this information, some of you may still find it interesting. A few call outs:

1) Commodities overall (energy, metals, agricultural products) are down more than 50% in the past 5 years.

2) Emerging market stocks are down almost 20% over the past 5 years. In fact, they never fully recovered from the financial crisis and are still down more than 25% from their October 2007 peak.

3) Large Cap US stocks (think S&P 500) have been consistent strong performers. It makes sense that that the S&P 500 is near an all-time high.

4) Note the diverse returns by asset class, especially bonds vs. stocks and US stocks vs foreign stocks. This diversification is what we ultimately want in portfolios. It “feels” bad when your home country is outperforming as the S&P 500 has for the past 5 years. There is a temptation to want to just invest in the S&P 500 since it has done well for a particular period of time in the past, but there are no guarantees that will continue for the future. In fact, it may be starting to reverse course (see #5 below). Diversification works over the long-term, not over the arbitrarily defined term.

5) Some of the worst performers over the last 5 years are some of the best performers year-to-date (commodities, emerging market bonds, emerging market stocks).

6) Notice the low, but consistent returns of US bonds. That’s why they’re part of your portfolio. They have very little (and often negative) correlation to the rest of the portfolio. These are true diversifiers in that they have positive expected returns, but tend to do well when other parts of the portfolio are doing poorly. The addition of bonds to a portfolio smooths out the roller-coaster of stock returns. The more bonds, the smoother the ride, but the lower the overall return will be.

7) While cash has paid essentially no interest over the past five years, Aggregate US Bonds have returned 20%, and with a very smooth ride along the way. This is why we favor bonds strongly over cash (other than as an emergency fund and for known upcoming spending).

Brexit Follow-Up – One Ugly Day Later

Quick update on the financial impact of Brexit after one day of trading. Bad in the US, but terrible overseas, especially in financials. Vanguard’s Total World Market ETF was down 5.35%. I like to use that as a proxy for all the assets in the world, which are worth 5% less today than they were yesterday at this time (or, more optimistically, they’re 5% cheaper than they were yesterday). Again, no one knows if this is an over-reaction, if there will be a bounce in the short-term, or if this is the beginning of a big move down. Most importantly, no one knows what the long-term economic impact will be. The unwinding of positions just needs to play out in the market for a while in the short term and a LOT of negotiations, votes, and policy decisions need to be made in Europe over the long-term (likely several years). Here’s where things settled today, with all returns below by representative ETF, in US Dollars (captures market impact and currency impact together):

  • US Large Cap Stocks: -3.6%
  • US Small Cap Stocks: -3.8%
  • US Real Estate Investment Trusts: -0.9%
  • US High Yield “Junk” Bonds: -1.6%
  • Foreign Developed Country Stocks: -8.2%
    • Foreign Developed Value (includes a lot of banks): -9.8%
  • Foreign Emerging Market Stocks: -5.7%
  • Foreign Real Estate Investment Trusts: -6.0%
  • Emerging Market Bonds (Local Currency): -3.3%
  • Aggregate Commodities: -1.8%
    • Oil: -4.8%
    • Gold: +4.9%
  • US Aggregate Bonds: +0.6%
    • US Short-Term Investment Grade Bonds: +0.1%
    • US Medium-Term Corporate Bonds: +0.3%
    •  US Long-Term Treasuries: +2.7%

Brexit

As I type this message, the votes are being counted in the UK referendum on whether to remain in the Euro zone or exit (British Exit, “Brexit”). With approximately 2/3rds of the voting areas reporting, the result looks like a narrow victory for the exit camp. This comes as a total shock to the financial markets, which had been pricing in a win for the Remain side, based on recent poll data, and similar votes in other countries in recent years. Virtually all economists are in agreement that this will have a detrimental impact on UK GDP, at least in the short-term, and maybe in the long-term. It also signals a possible unraveling to the Euro zone if other countries reach similar decisions. The future impact is all based on speculation at this point. Is it better for the UK to extract itself from a potentially failed experiment in trying to combine countries in Europe that are too culturally different to be combined, even if there is some short-term economic pain? Might it even be better for the world if the countries of the Euro zone all return to their previous status as completely separate entities that are not as dependent on each other? Or does the obliteration of trade agreements, a common currency, and a determination to become more unified wind up hurting global growth irreparably? No one knows these answers.

What we do know is that when financial markets are shocked by an unexpected event that MAY have major economic implications for the future (MAY emphasized, because whether it does have those implications or not is irrelevant), volatility ensues. In this case, it is led by the currency markets as the value of a British Pound can change dramatically if the market in aggregate believes now that investments in the British economy will offer poorer returns in the coming years than they did yesterday. Major swings in one currency often trigger major swings in other currencies in a rush to safety (US Dollar) and away from riskier and higher yielding currencies. Currency swings impact the economies of the countries that use those currencies. Currencies that depreciate in value gain an export advantage over other countries, but the cost of imported goods can rise sharply and hurt more than the exports can stimulate growth. Stock market fluctuations follow from the economic impacts and volatility there can be self-fulfilling as leveraged losing bets cause additional forced selling via margin calls and fund liquidations. In financial markets, fear begets fear. As you might expect, the British pound is incurring substantial declines in overnight markets… currently down almost 10% vs the US dollar, back to levels not seen since 1985. World equity markets are also suffering, with US markets down 3-4%, the UK down 7.5%, and Asian markets down as well. US bonds are a bright spot, as is almost always the case in situations like this, which is the reason we include bonds in your portfolios even when interest rates are low. They are a source of stability and are negatively correlated with other assets.

While it’s always possible that there will be a quick snap back rally, events such as this tend to take a while to play out in the markets as bottom-pickers try to time their bets (exerting buying pressure and causing a rebound in prices), while funds with liquidation requests and leveraged bets that led to margin calls force additional selling (downward pressure) on the markets. As is usually the case, the market knows best what a fair price is given the current situation, so we don’t see this as a reason to panic and sell, or a particular “buying opportunity” beyond the investing of spare cash that you should always be doing and that’s part of your financial plan. It’s merely something that has now happened and is priced into the markets. Over the long-term, the economic impacts will play out, and prices will continue to adjust as those impacts are better understood.

The long and short of Brexit is this: tomorrow is likely to be a very ugly day in most financial markets. The gains of the last few months are likely to be wiped out (and then some). Will that change the fact that over the long-term, populations will continue to grow, people will continue to work, and productivity will continue to increase through process and technological advances? Call me skeptical, but I doubt it. The world’s economic output, in all likelihood, will continue to grow over time and we’ll look back on this as yet another event in the history of financial markets that caused a lot of headlines to be written and a lot of fear to swell over a temporary blip in overall growth. We have no idea whether the UK will benefit or be hurt by their democratic decision (if they even go through it). But the world as a whole will be just fine after some time to adjust to the new landscape. In other words, I sincerely doubt any of you will be telling your grandchildren that their lives would be so much different if only 2% more of the UK voted to stay in the EU on 6/23/16.

Q4 and Full Year 2015 Market Segment Performance

Just a quick snapshot of Q4 and 2015’s selected returns by segment of the market (returns are those of the segment’s representative ETF). It was a mostly flat to slightly down year with US Large Company stocks up slightly, but US Small down slightly more. Foreign Developed areas were up over 7%, but Foreign Emerging was down more (~15%). REITs were up a bit, but high-yield down a bit more. The noted exception area to the mostly flat to slightly down market was in Commodities. Led by oil (-46%), commodities in aggregate were down 28%, following their almost 19% drop in 2014

On the bright side, Q4 was mostly positive (again with the exception of Commodities). And inflation (as measured by the CPI) remains very low thanks mostly to the fall in commodity prices. The high correlation between your spending and commodity prices (esp. energy) is why we include commodities in investment portfolios. It’s ok if that portion of your portfolio falls in value if inflation is substantially lower than the 3% expectation we incorporate into most financial plans. The reverse is also true… If commodity prices rise sharply, your spending has a tendency to increase more than planned and the commodity portion of your portfolio is likely to rise along with it.

2015Q4-1

Stocks / REITs / High Yield / Commodities over the course of the year:2015Q4-2

Bonds over the course of the year:2015Q4-3

As a reminder, while it might not feel good, unless you are retired and no longer saving money, you are far better off with flat to down markets that rise later in life than you are with a market that moves steadily upward. It allows more investing at lower prices which results in a higher amount of total wealth assuming the same endpoint (see The Value Of Volatility). If you are retired and no longer saving, you’re likely to be in a much more conservative portfolio with lower expected returns factored into your financial plan so that the occasional down year in stocks doesn’t have a big impact on the plan overall.

Who Pays Federal Income Taxes

Per the Tax Foundation, the IRS released updated federal tax burden numbers for tax year 2013. In case anyone is interested, some numbers below that show the progressivity of the federal tax system and help you figure out where you fit in. No political intentions with this post… I leave that to the politicians. I’m sure there are about as many readers who feel there’s too much progressivity as there are those who feel there’s not enough.

· The top 1% of filers had adjusted gross income (AGI) of at least $429k, earned 19% of the total AGI for all filers, and paid 38% of all Federal income tax.

· The top 5% of filers had AGI of at least of at least $180k, earned 34% of total AGI, and paid 59% of all Federal income tax.

· The top 10% of filers had AGI of at least $128k, earned 46% of total AGI, and paid 70% of all Federal income tax.

· The top 25% of filers had AGI of at least $75k, earned 68% of total AGI, and paid 86% of all Federal income tax.

· The top 50% of filers had AGI of at least $37k, earned 89% of total AGI, and paid 97% of all Federal income tax.

· The bottom 50% of filers had AGI less than $37k, earned 11% of total AGI, and paid 3% of all Federal income tax.

Note that in most cases, AGI is all sources of income (wages, self-employment, investments, rents, etc.) minus items that are excluded from income (401k contributions, health insurance premiums, FSAs, etc.) and certain “above-the-line” deductions (HSA contributions, IRA contributions, etc.). It does not subtract out itemized deductions, the standard deduction, or personal exemptions. Those come out of AGI to determine taxable income, to which the tax rates are then applied. The taxes paid above also excludes social security and medicare taxes since they’re not part of the federal income tax.

Full analysis and historical date back to 1980 are available on The Tax Foundation website.

Tax Extenders – Some To Be Permanent!

There have been a group of provisions in the tax code that have been expiring every year or two, forcing Congress to pass last-minute laws each December to prevent them from expiring. Yesterday, the Ways & Means Committee in the House came to terms on a deal to handle these “tax extenders”, which includes making some permanent and ending the year-to-year uncertainty. It is widely expected to pass the House & Senate and become law. Here’s a brief description of what’s included in The Protecting Americans from Tax Hikes (PATH) Act Of 2015:

  • State & Local Sale Tax Deduction – Taxpayers who itemize can choose to deduct either their income taxes paid to states, or their sales taxes paid to states. Residents of states that have no income tax (and who don’t travel for work) use the sales tax deduction. The ability to deduct sales taxes ended in 2014 and is retroactively made permanent starting in 2015 by PATH.
  • Teacher Expense Deduction – Up to $250 “above-the-line” (you don’t have to itemize to take it) deduction for teachers who purchase school supplies out-of-pocket and are not reimbursed. This provision would have ended in 2015, but PATH will make it permanent.
  • American Opportunity Credit – Credit for up to $2500 per year of the first four years of post-secondary education (subject to income limits). This was scheduled to lapse after 2017 and revert back to the old Hope Scholarship Credit but is instead made permanent by PATH.
  • Deduction For Qualified Tuition & Fees – “Above-the-line” deduction for up to $4k of college tuition/fess (subject to income limits), but can’t be used in the same year as the American Opportunity Credit. This provision ended in 2014 and is retroactively extended for 2015 and 2016 by PATH.
  • 529 Plan Eligible Expenses – PATH now allows college 529 plans to pay for computers and related expenses in addition to the previous tuition, room, and board.
  • Qualified Charitable Distributions (QCD) – Taxpayers over age 70 ½ can make up to $100k of charitable contributions per year, directly from an IRA, without treating the IRA distribution as income. It can also satisfy part or all of a Required Minimum Distribution (RMD). This provision ended in 2014 and is retroactively made permanent starting in 2015 by PATH.
  • Discharged Mortgage Debt Exclusion – Allows discharged mortgage debt on a principal residence (via short-sale, foreclosure, bankruptcy) to be excluded from income. This provision ended in 2014 and is retroactively extended for 2015 and 2016 by PATH.
  • Mortgage Insurance Premium Deduction – Allows a deduction (subject to income limits) for amounts paid for mortgage insurance (PMI, etc.). This provision ended in 2014 and is retroactively extended for 2015 and 2016 by PATH.
  • Immediate Expensing Of Purchases – “Section 179” expensing allows up to $500k of asset purchases (phased out after $2M of total purchases) to be immediately deducted in the year of purchase instead of being depreciated over the life of the property. This provision was due to revert back to a $25k max per year phasing out if purchased property exceeded $200k in 2015, but is now retroactively extended, made permanent, and indexed to inflation by PATH.
  • Bonus Depreciation – For purchases that don’t qualify for Section 179 expensing (or when Section 179 expensing is not elected), bonus depreciation allows 50% of the purchase price to be depreciated in the year of purchase. This provision lapsed at the end of 2014, but PATH retroactively brings it back for 2015 and maintains it through 2017. In 2018, the bonus drops to 40% and in 2019 it drops to 30% before expiring again for 2020.

[Edit 12/18/2015 :

  • Solar Energy Credit – The 30% residential solar credit that was supposed to expire in 2016 will apply through 2019 and then phase out until it expires in 2022.


What The Fed Rate Hike Means For You

In a widely expected move, the Federal Reserve raised the Fed Funds target rate range from 0-0.25% to 0.25-0.50% earlier today. They forecast a gradual (though not set in stone) increase in that rate by about 1% per year until reaching a terminal rate near 3.5% in 2018. This marks the end of seven years of ZIRP (Zero Interest Rate Policy) and is the first rate hike in nine years. I wanted to take a minute to clarify how this move is likely to impact you. There is a perception that the Federal Reserve controls nearly all rates on all financial products, which is not the case. Below is a non-exhaustive list of what will likely be impacted immediately and over the longer term. As always, if you have questions about something that is or is not covered below, please don’t hesitate to ask.

· Interest Paid By Your Bank On Your Savings – Likely no impact at all in the short-term. The average checking account will still pay approximately 0.00%. The average savings account will still pay approximately 0.05%. Online savings banks, some credit unions, some local banks, etc. will continue to pay in the 0.5-0.9% range. It is very unlikely that the big banks (BoA, Wells, JPMorganChase, etc.) will raise their rates on savings as a result of the Fed hike. Once the Fed Funds rate gets to 0.75%-1.00%, we’re likely to see the big banks begin to pay more in interest and move rates up slightly less than 0.25% with every 0.25% hike by the Fed. While the banks get paid more on their reserves, they won’t really have an incentive to pass that along to the consumer until rates are a bit higher and they start competing over customers. This is akin to when oil prices come down suddenly, but prices at the gasoline pump move down much more slowly over an extended amount of time.

· 15 & 30 Year Fixed Mortgage Rates – Likely little impact in the short-term. Mortgage rates are tied to longer-term rates than the Fed Funds rate (which is an overnight lending rate). Long-Term rates are much more tied to the economy, the supply of and demand for money, competition with long-term rates in other countries, and expected long-term inflation than they are to the short-term rates that are controlled by the Fed. The Fed will move short-term rates up as the economy improves, so in a sense, long-term rates should come along for the ride over time as economic growth leads to higher inflation expectations and higher demand for money. In reality though, increasing short-term rates tends to put a brake on economic growth and given the extreme policies in Europe and Japan that are geared toward keeping long-term rates down in those countries, it’s unlikely that US long-term rates can move up very far very fast.

· Variable Loan Rates (mortgages & other) – Likely to move up in lock-step with the increase in Fed Funds. Most variable rate loans are tied to the PRIME rate (generally 3% above the Fed Funds rate and controlled by banks) or to 1-month, 3-month, or 1-year LIBOR (another short-term lending rate that is very closely tied to the Fed Funds rate plus a premium for credit conditions). The big banks increased their PRIME rate to 3.5% shortly after the Fed’s announcement today. LIBOR has been floating up in expectation of the Fed announcement. As an example, if you have a Home Equity Line Of Credit (HELOC) with a rate that is PRIME + 0.5%, you’ve been paying 3.75% interest on that loan for the past 7 years. As of today, that rate is now 4%. By the end of 2016 it is likely to be 5% and by 2018 it is likely to be 7% if Fed projections are correct. If you have a variable rate primary mortgage that is 1-year LIBOR + 2.75% rounded up to the nearest 1/8th of a percent, that rate was 3.375% a year ago and today it’s 3.875%. It would likely be ~5% by end of 2016 and ~7% by end of 2018 if Fed projections are correct. You can expect a point-for-point increase in the rate of loans tied to PRIME and a close to point-for-point increase in loans tied to LIBOR. LIBOR loans could also see additional increases if credit tightens (like it did in the extreme case in 2008/09 after Lehman Brothers failed and no one trusted lending money to anyone else for a while).

· Economic Growth – There is a school of thought that believes that ZIRP was hurting economic growth and causing dislocations through the financial system. The more traditional economic view is that the lower the Fed Funds rate, the more stimulative it is for growth. I personally believe that low rates are stimulative in that they encourage more borrowing, more lending, more spending, more investing, and less saving (cash sitting around doing nothing). However, the longer rates stay low, the more they push investors into riskier investments in seeking higher yields. This applies both to financial institutions (a SF Credit Union offered a $3M mortgage with no downpayment required last week, for example), and to individual investors putting money in high-yield investments without considering the risk (see this article from Bloomberg about a recent high-yield bond mutual fund that recently told investors they couldn’t sell and get their money back). Eventually, excessive risk-taking leads to a bubble which inevitably leads to a crash. So, in a sense, the Fed’s rate increase and guidance that they will continue to normalize rates helps to avert a growing bubble/crash scenario. Fear subsiding can lead to higher economic growth. Whether that is enough to offset the negative growth impact in reduced lending, borrowing, investing, and spending remains to be seen. A 0.5% Fed Funds rate and $4 Trillion Fed balance sheet are extremely stimulative. But with each increase in rates, and with each reduction in the size of that balance sheet (which will start eventually), they become a bit less stimulative. Economists generally believe that the level of rates and size of the balance sheet are more meaningful than the direction of movement in those rates and the balance sheet. The aggregate psychology of the financial markets seems to put more weight in the direction of movement. I suspect that short-term, the markets will have their way and price in a slowdown in growth, some of which has already started. The Fed’s challenge is that if markets believe higher rates will cause a recession, that belief alone can cause the recession as businesses pull back investment, consumers slow their spending, layoffs start, etc. It remains to be seen whether the Fed can maintain confidence via a very slow trajectory of rate hikes, in which case they’ll be able to normalize rates over time while continuing to let low rates stimulate growth during the rate hike cycle.

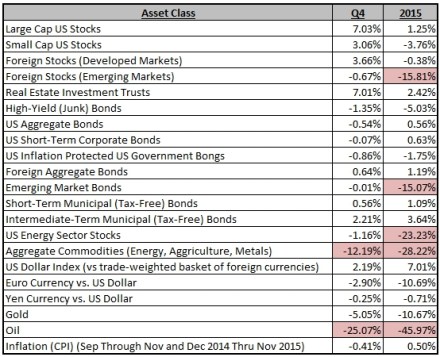
· Inflation – Inflation is currently running near zero year over year, mostly due to the impact of the sharp decline in commodity prices. This has run counter to everything in economics textbooks. Central banks all over the world have been printing money to try to stimulate growth and avoid deflation. Even with trillions more dollars, euros, and yen in the system, the aggregate price of goods is not rising. The Fed believes the impact of energy is “transitory” in that lower energy prices tend to feed through the economy short-term and hold inflation down, but over the long-term lower energy prices provide an engine for growth. They believe inflation will get back to their target, which is 2% per year, over the next few years. They say they’re increasing interest rates starting now so that they can do it in a gradual manner rather than waiting until inflation picks up which would cause them to move more aggressively with rate hikes to fend off a hyperinflation scenario (which has caused recessions in the past). Again, it remains to be seen whether they’ll be successful or not.

· US Dollar Relative To Foreign Currencies – The dollar has been on a big run relative to other currencies since mid-2014. Money usually chases higher rates and safety (which rarely go hand-in-hand). In this case, the US looks safer than virtually any other country (some plagued by political instability, others by a banking crisis, others by fiscal issues), and it had the prospects of increasing rates over time while other major parts of the world are decreasing rates and/or printing money to fend off recession. Higher US interest rates are widely expected to continue to increase the dollar’s value relative to other currencies. At some point though (and maybe it’s here), a higher dollar starts to impact US exports substantially, starts to push more work offshore where labor is cheaper, and starts to make foreign investments look cheap in dollar terms while US investments look expensive in foreign currency terms. All of those things can put a dent in US growth and cause interest rates (and therefore the dollar) to come down. There’s no way to know what’s going to happen, but it definitely feels like the dollar is getting very expensive and foreign currencies (particularly those of emerging markets) are getting very cheap. One thing is certain… if you live in the US, are paid in US dollars, and like to travel the globe, it’s a LOT cheaper to do it today than it was a couple of years ago.

Updated 2016 Tax Numbers

The IRS has released the key tax numbers that are updated annually for inflation, including tax rates, phaseouts, standard deduction, exemption amount, and contribution limits. Since inflation was very low in 2015, only very small changes have been made. Some notable callouts for those who don’t want to read all the way through the update:

· Social Security payments will not increase (no cost-of-living-adjustment) in 2016. That also means that by law, the Social Security Wage Base (the max amount of income subject to the 6.2% Social Security Tax) also must remain unchanged at $118,500.

· Max contributions to 401k, 403b, and 457 retirement accounts remain unchanged at $18,000 (+$6000 catch-up if you’re at least age 50).

· Max contribution to a SIMPLE retirement account remains unchanged at $12,500 (+$3000 catch-up if you’re at least age 50).

· Max total contribution to most employer retirement plans (employee + employer contributions) remains unchanged at $53,000.

· Max contribution to an IRA remains unchanged at $5,500 (+$1,000 catch-up if you’re at least age 50).

· The phase out for being able to make a Roth IRA contribution is $194k (married) and $132k (single). Phase out begins at $184k (married) and $117k (single).

· The standard deduction remains unchanged at $12,600 (married) and $6,300 (single) +$1,250 if you’re at least age 65.

· The personal exemption increases slightly from $4,000 to $4,050 per family member. Remember that exemption amounts begin to be phased out if your income exceeds $311,300 (married) or $259,400 (single). The exemption is reduced by 2% for every $2500 of AGI over threshold until reduced to $0.

· Itemized deductions are reduced by 3% of the amount AGI is over $311,300 (married) or $259,400 (single).

· The annual gift tax exemption remains at $14,000 per giver per receiver.

· The maximum contribution to a Health Savings Account (HSA) is $6,750 (married) or $3,350 (single).

· Note that mileage rates have not been updated yet for 2016.

Click image below for details…  red indicates not yet updated from 2015.

Presentation1

Down Markets

A down Q3 across virtually all asset classes has dragged most everything down over the last 52-weeks. For reference, the performance of those asset classes is shown below:

PS – this is why we don’t just take all client money and put it into an emerging markets fund (which is the asset class with the highest expected growth long-term), and why we include bonds in all portfolios.

Market Update – 8/24/2015

Most of you know by now that when you see a “Market Update” post from me, something ugly is happening in the financial markets. This time, it’s the classic fear of a global growth slowdown, with China at the center of the action. There’s plenty of literature out there pointing to all of China’s problems, so I won’t bore you with a recap. Growth there is slowing, dramatically, and there’s little debate about that. For a long time, emerging market growth was thought to be enough to overcome the stagnation that has happened through much of the developed world. Slowing growth (maybe even a real recession?) in Asia, eastern Europe, the Middle East, and Latin America has left financial markets wondering what can drive global growth. Without it, it’s hard to imagine that corporate profits can continue to grow, hiring will increase, spending will rise, and the virtuous cycle will continue. Oil prices have plunged, partially due to the increase in supply led by the US shale revolution, but lately, I suspect it’s again due to demand slowdown fears led by China. While lower commodity prices are beneficial for consumers, it puts a halt on the growth of one of the sources of job gains in the US and provides even more basis for worrying about global growth. Add in fears of the Fed starting to raise rates soon (which almost certainly isn’t going to happen in September now thanks to the recent stock rout), and we have the makings of a meltdown.

[As I write this at 9:30am, the US stock market just opened and the market itself is not functioning properly. There are stocks and funds that opened down 20%+, were halted, and bounced back sharply. It looks a lot like the flash crash of a few years ago. I’d venture to guess that many of those trades will be cancelled by the end of the day. Many stocks did not open on time. Don’t believe what you’re seeing for quotes until that’s all resolved. I suspect the Dow was never really down the 1000+ points that were indicated shortly after the open.]

I don’t know how bad China will get. I don’t know how much fear will beget fear and cause stocks to fall. I don’t know how long it will take for everything to stabilize. What I do know is that China won’t be wiped off the map and that a billion people have a massive amount of productivity to deliver to the world as skills, technology, and resources move from other parts of the world to China. There is a massive portion of the developing world that is living in or on the edge of poverty. Technology is moving so quickly, making the world smaller and smaller and it seems impossible that the disparity in standard of living between the developing and developed worlds can continue forever. Emerging markets will drive growth eventually… It just make take a while to get through some of the policy mistakes their governments have made and to normalize some of the capital flows that have probably put too much of the developed world’s central bank provided liquidity into emerging markets in search of yield. While the media may try to convince you otherwise on a day like today, the world is not ending.

Take this as a gut check. After years without a major fall, there is a tendency to think that stocks go up in good times, and do nothing in bad times. We’ve forgotten that stocks also go down and they tend to go down much faster than they go up. This causes stress when portfolios have not been set up appropriately for your goals. Ask yourself this question: “If the stock market loses half its value as it did twice in the last 15 years, will I still be able to achieve my goals?” The answer to that question is dependent on what your goals are, how soon you need your money, and how much of your portfolio is in the stock market. If your goal is retirement in 20 years, then you’re going to have most of your money in the stock market and downturns are going to be painful, but you (and your portfolio) won’t even remember that this downturn occurred by the time your retire. If you’re looking to buy a house with most of your money in the next couple of years, then most of your money is in bonds, which actually do fairly well when stocks move lower allowing them to offset some of the stock fall and mute the impact on your portfolio. The real concern for investors should be whether or not you’ve really evaluated your goals and communicated them to your advisor. As long as we’re on the same page, your portfolio is allocated in a way that the stock market falling 10%, 20%, or even more isn’t going to ruin you. That doesn’t mean your portfolio won’t go down… I assure you it will and that’s a necessary risk in order for it to go up in the good times. It means that you should still be able to achieve your goals even if stocks fall sharply over the short term. As I posted on Twitter on Friday, “If it matters to you that stocks fell today / this week, you’re gambling, not investing.” If you feel like you’re gambling and you’re worried, please contact me. It means you’re letting your emotions get the best of you (and I’m happy to talk you off the ledge) or that your portfolio isn’t in line with your goals (which means we really need to talk).

I’ll conclude with something no one wants to hear while the market is falling, but everyone realizes is true eventually. Investing at lower prices actually increases long-term wealth and the probability of achieving your goals. In my most rational moments (which are admittedly hard when the entire world’s stock markets are down 10%+ over two days), I cheer when the market falls and get more nervous when it rises because I know your long-term goals (and mine) have a better chance of success when prices are lower and we can invest more money at those lower prices (see The Value Of Volatility post from 2013). Would you rather your next 401k contribution get invested at last week’s higher prices or this week’s lower prices? Buyers should always want prices to be lower, even if it doesn’t feel good at the time. On days like today, which definitely don’t feel good, please keep that in mind.