This post contains the usual returns by asset class for this past quarter (by representative ETF), year-to-date, last 12 months, last five years, last ten years, and since the covid low (3/23/2020). While there is still no predictive power in this data, I’ll continue to post this quarterly for those of you that are interested.


A few notes:
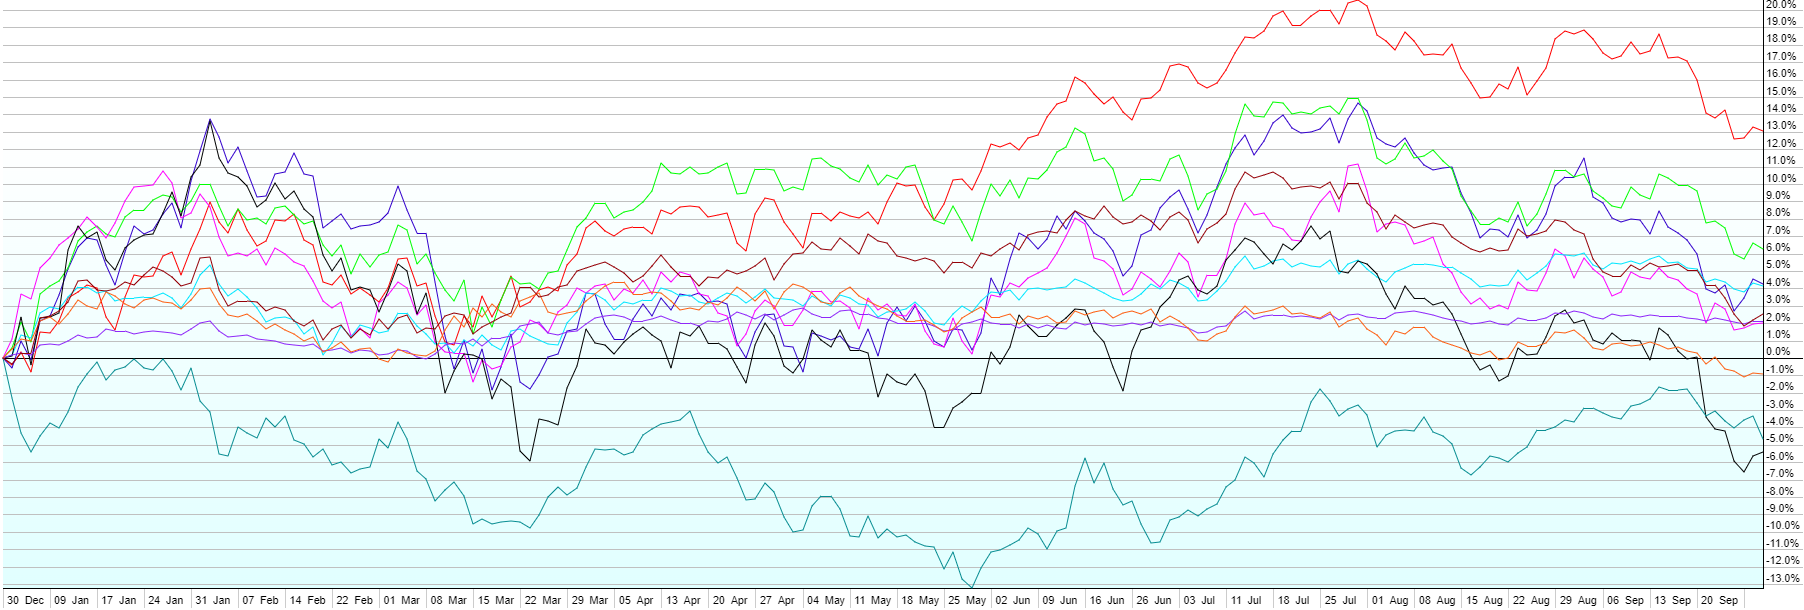
- After a stellar July, Q3 ended in disappointing fashion with almost all major asset classes finishing in the red as long-term interest rates hit their highest levels in 15 years. Inflation continues to soften, but the Fed has sustained their hawkish stance indicating the possibility of additional interest rate hikes, while pushing off future cuts well into 2024. The economy continues to chug along, for now, but higher rates are starting to take their toll. Debate rages on as to whether the majority of the hikes of the past 18 months have flowed through the economy or whether the long and variable lags leave the worst yet to come. Job growth has slowed and unemployment has begun to tick up slightly from historically low levels. Mortgage rates approaching 8% have locked up much of the housing market as it becomes tougher and tougher for homeowners to give up their 3% 30-year fixed in favor of another home with an 8% mortgage. Yet GDP growth is likely to be in the very solid 3-4% (annualized) range for Q3 as a whole when it is reported later this month.
- Overall for Q3, from best to worst: Commodities (+5.1%) as energy prices spiked; Short-Term Corporate Bonds (+0.2%); High-Yield Bonds (-0.3%); Emerging Market Stocks (-2.8%); US Large Cap Stocks (-3.2%); US Aggregate Bonds (-3.2%); US Small Cap Stocks (-4.6%); Foreign Developed Stocks (-4.7%); Emerging Market Local Currency Bonds (-5.1%); Real Estate Investment Trusts (-8.6%).
- While the S&P 500 is still up 12% year-to-date but the rest of the market has lagged with Small Caps only up 4% and Foreign stocks up about 5% overall. Short duration bonds have held their own, up about 2%, but the longer the duration, the worst the performance year-to-date as bond prices move in the opposite direction of rates, offsetting fairly high interest payments.
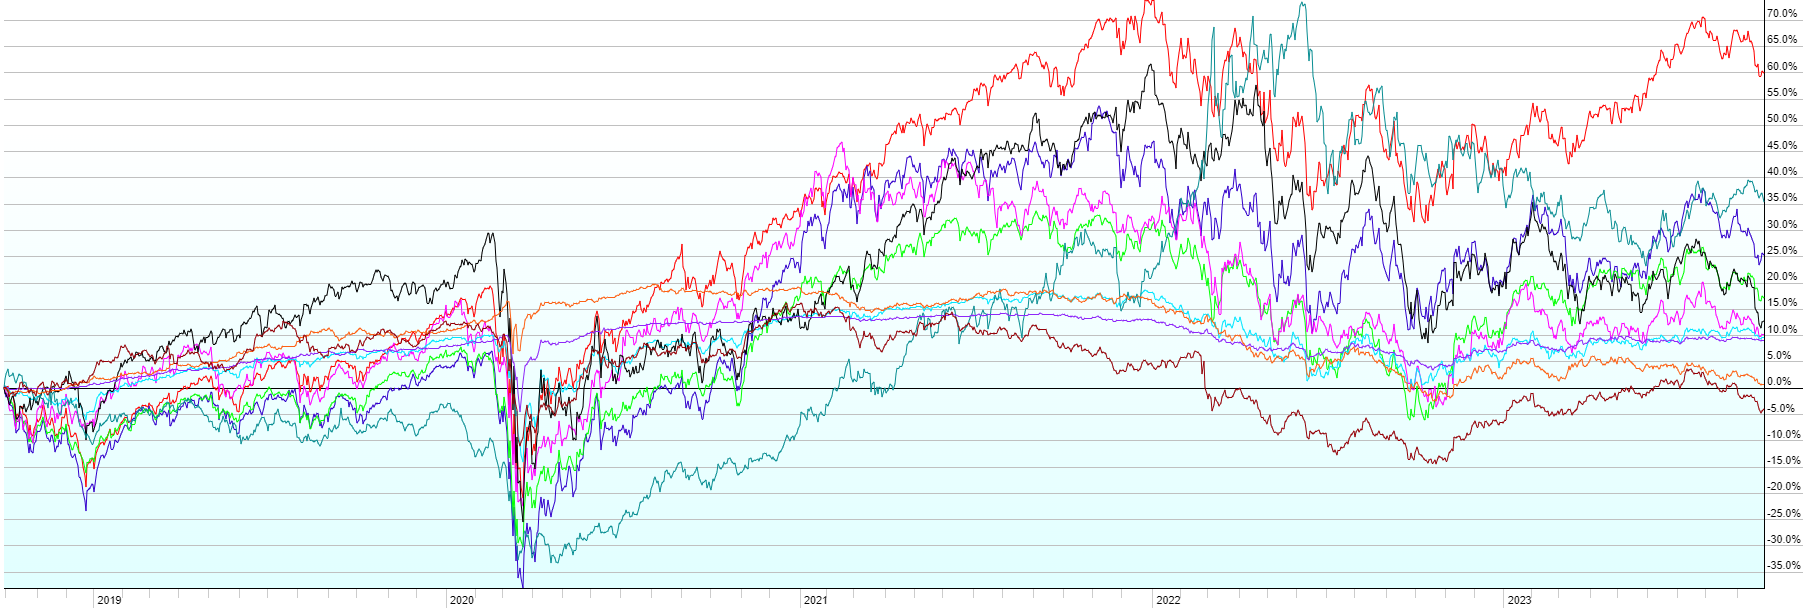
- The longer-term charts continue to show the value of diversification and remaining invested for the long haul. Especially notable is the strong performance of almost all asset classes since the Covid low in March 2020. Note that that low occurred right around peak global fear and the beginning of the lockdowns.
